Key Takeaways
- BTC’s price fills a strong smart money liquidity zone of $102,000, as the price appears ready for a bullish rally.
- Bitcoin’s price trading below $100,000 could trigger large long liquidations according to the liquidation heatmap.
- The overall market trend for BTC remains bullish despite a sudden market retracement that has pushed it above its all-time highs.
Following a strong breakout for Bitcoin in May, which pushed the price towards an all-time high of $111,700, the price of Bitcoin met strong resistance above this liquidity zone, initiating a strong selling price action from this high towards a key region of $102,800 after breaking its psychological level of $109,000.
The price rejection from its all-time highs was seen as whales and smart money manipulating its price heading into the monthly close, which will allow buying orders created around lower regions of $102,000 to be filled before the price would rally more to its upside region as the region of $102,000 and $97,000 was strong liquidity zone that needed to be filled up by smart money movers.
The price of BTC retraced towards $102,000, filling this zone as the price has shown incredible strength, rebounding from this region to the upside. The $97,000 liquidity zone remains unfilled, as the price is likely to return in the future and fill this zone.
The current market structure for BTC remains bullish following its sharp price decline, as the price appears poised for a potential price rally to the upside. While the price remains technically strong, we will analyze what Bitcoin liquidation heatmaps could be indicating ahead of its potential rally.
Market Sentiment Around BTC Liquidation Heatmap

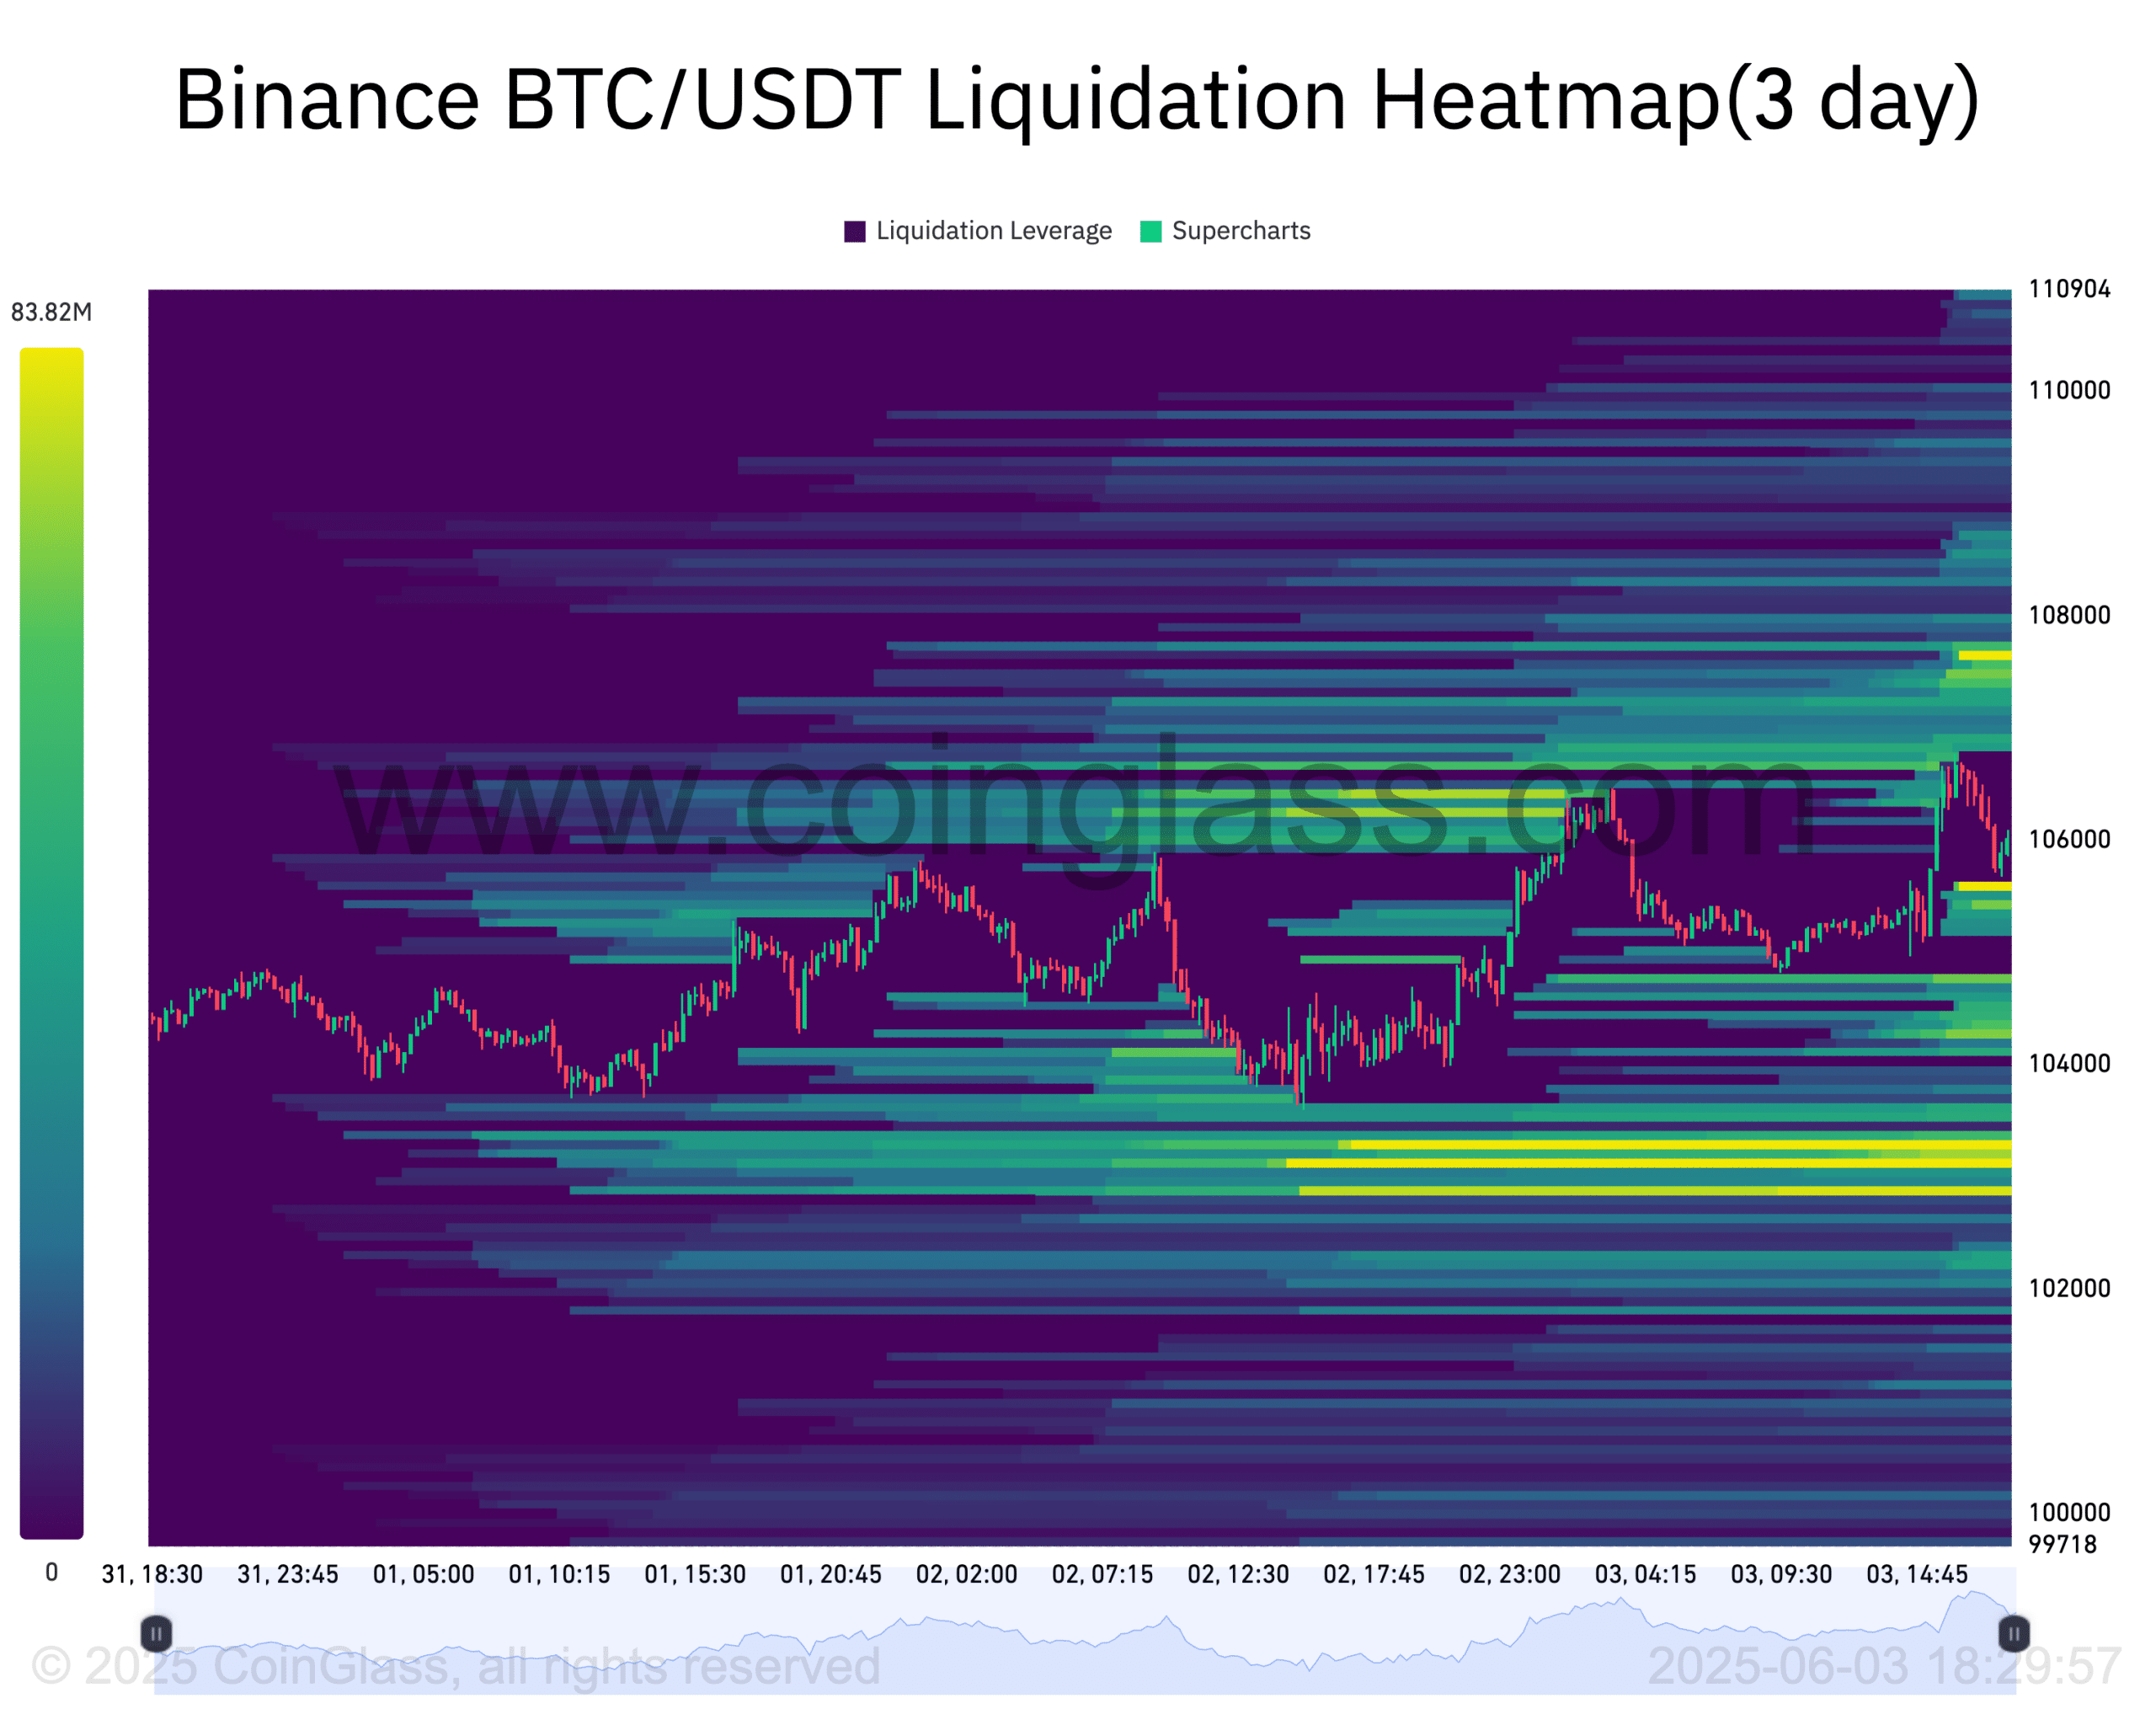
Source – BTC Liquidation Heatmap From Coinglass
According to the Bitcoin 3-day liquidation heatmap, the price of Bitcoin has formed a strong bullish support of around $102,000 after filling its liquidity zone in that region, as the price has bounced strongly and could be headed towards its all-time highs.
A market retracement of the BTC price towards $100,000, acting as key support, could trigger massive liquidations for BTC long after whales and traders initiate a buy, setting up stop-losses around those zones.
June hasn’t been the best month for BTC in the past, as the price has historically struggled to show strong upward price movement; a strong price rally could defy that notion, with the price rallying towards a potential high of $120,000 or more.
BTC Price Prediction For June – Is Bitcoin A Buy or Sell Today?

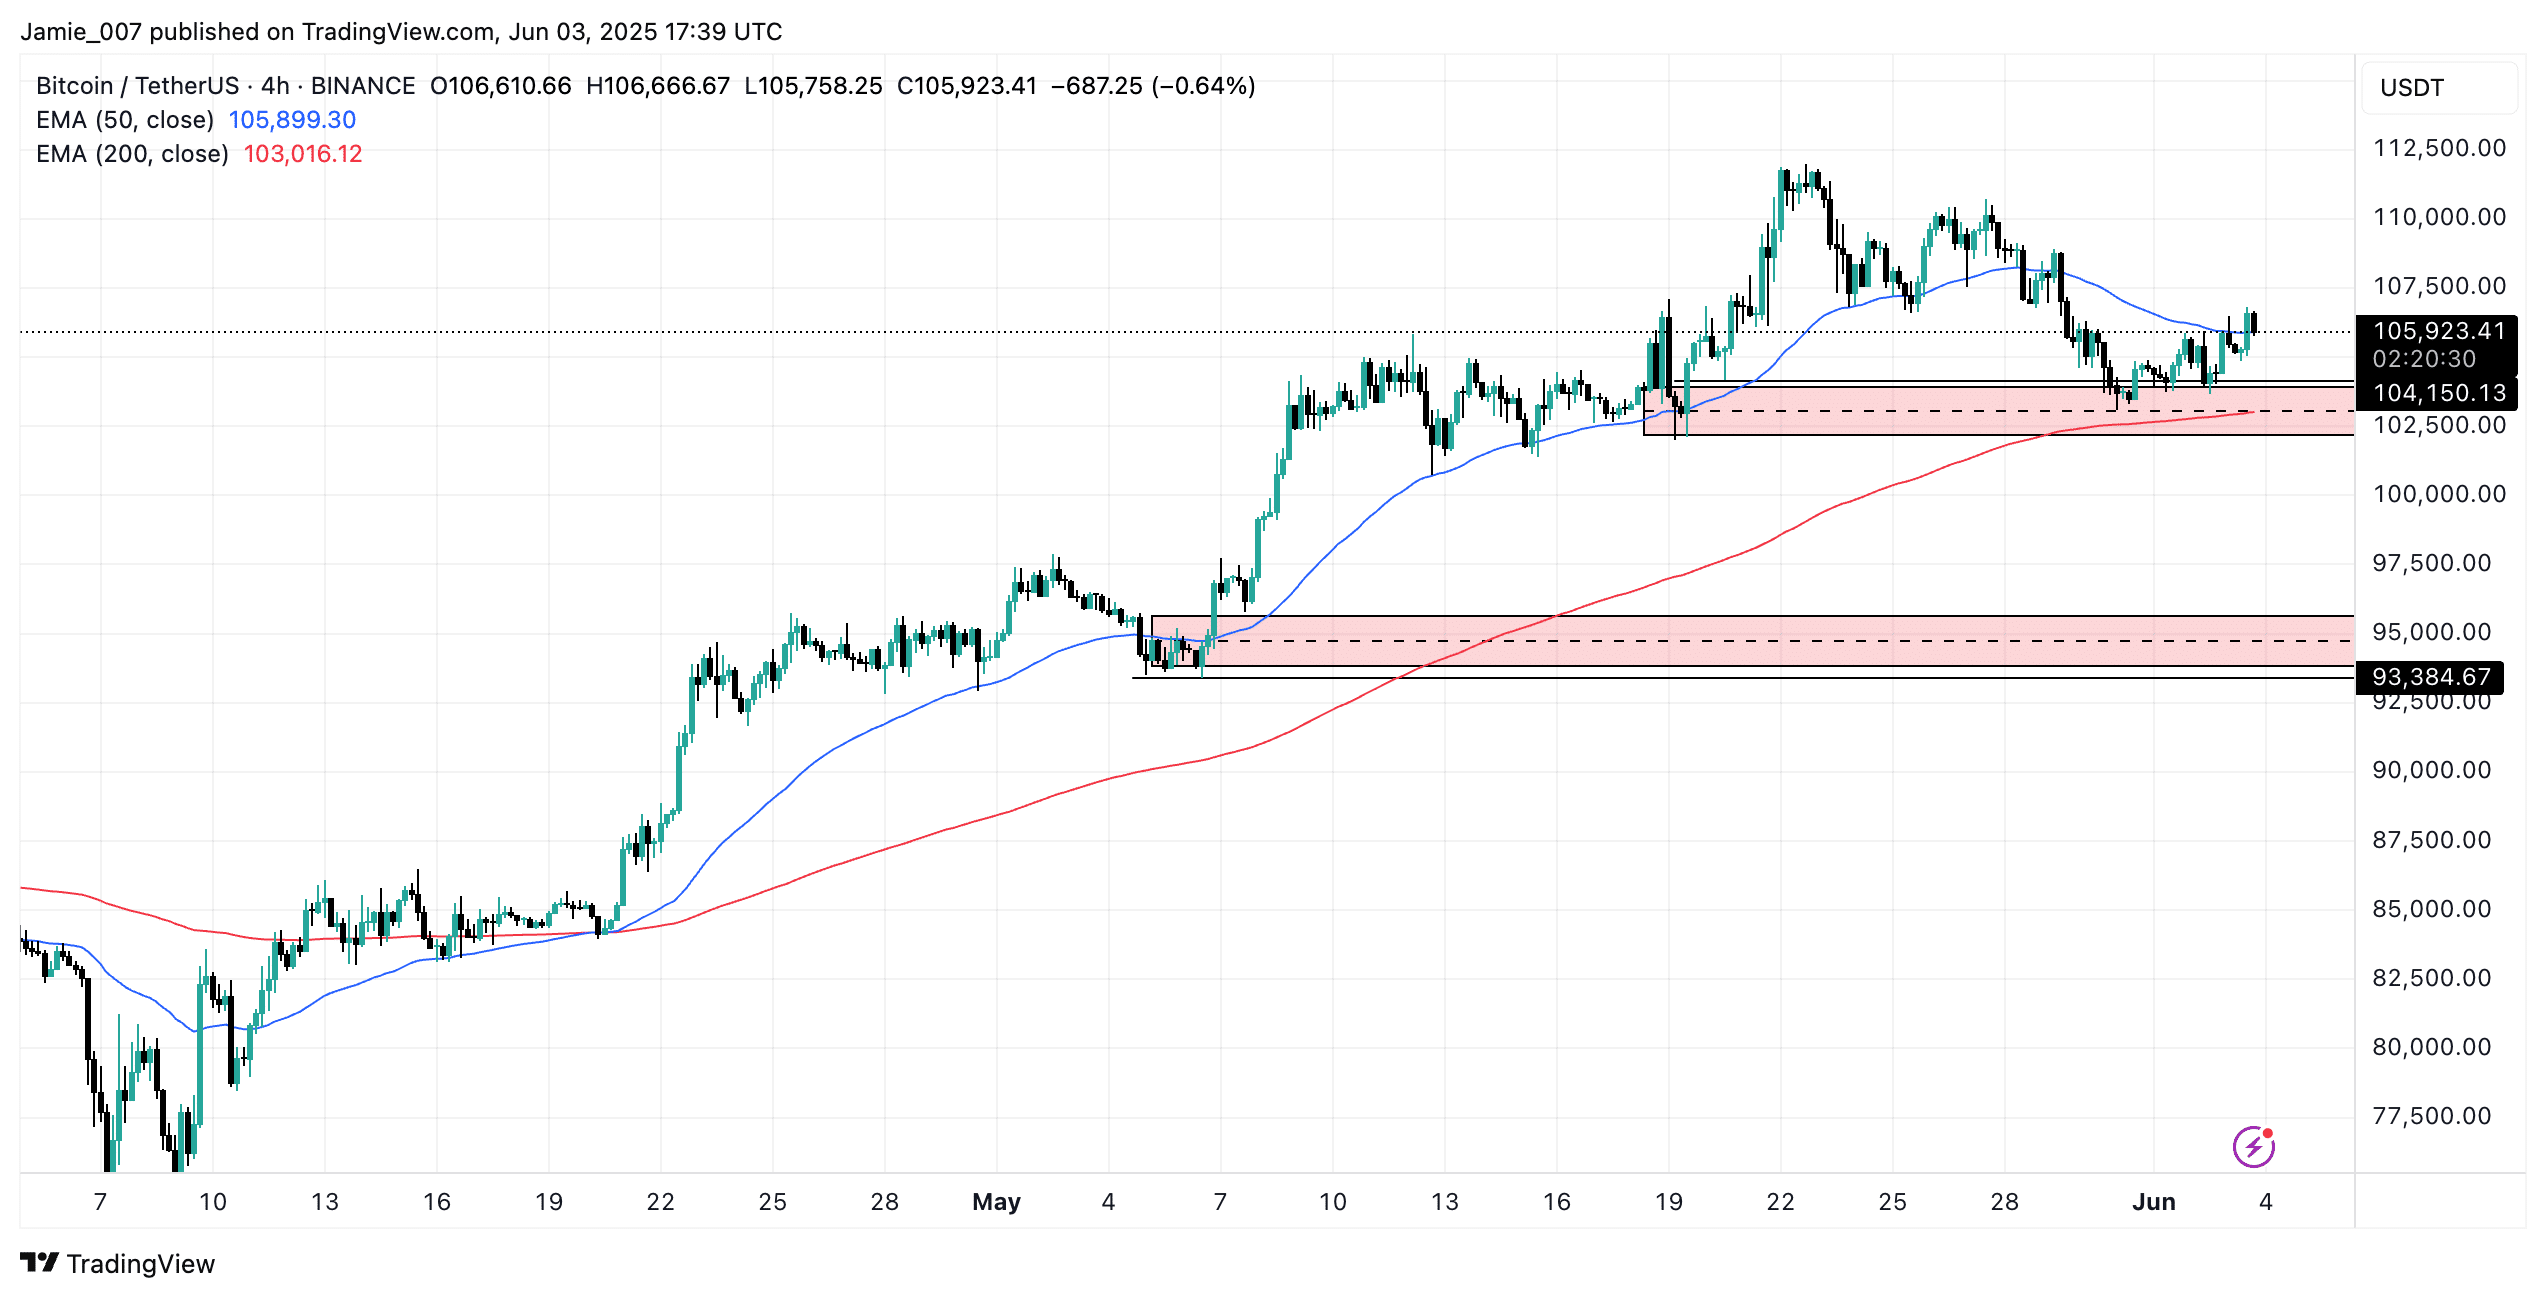
Source – BTC 4HR Price Chart From TradingView
On the 4-hour price chart, the price of BTC has exhibited strong bullish momentum, having created higher highs, which indicates a clear shift in market trend. This follows a decline from its all-time highs of $111,700 towards a key demand zone, with the price now poised for a bullish price continuation.
Bitcoin’s price trading above $100,000 is a positive sign for whales and Bitcoin traders, as prices are likely to look for a strong price rally to the upside in the coming days or weeks. If the price of BTC breaks below a low of $100,000, we could see a push lower of its price towards key demand of $97,000, where liquidity is resting to be filled.


