Let’s examine the insights shared by our Technical Analyst at UseTheBitcoin as he walks us through his personal trading approach and observations for Bitcoin (BTC) and Notcoin (NOT).
Bitcoin (BTC)
Price Action & Support Levels
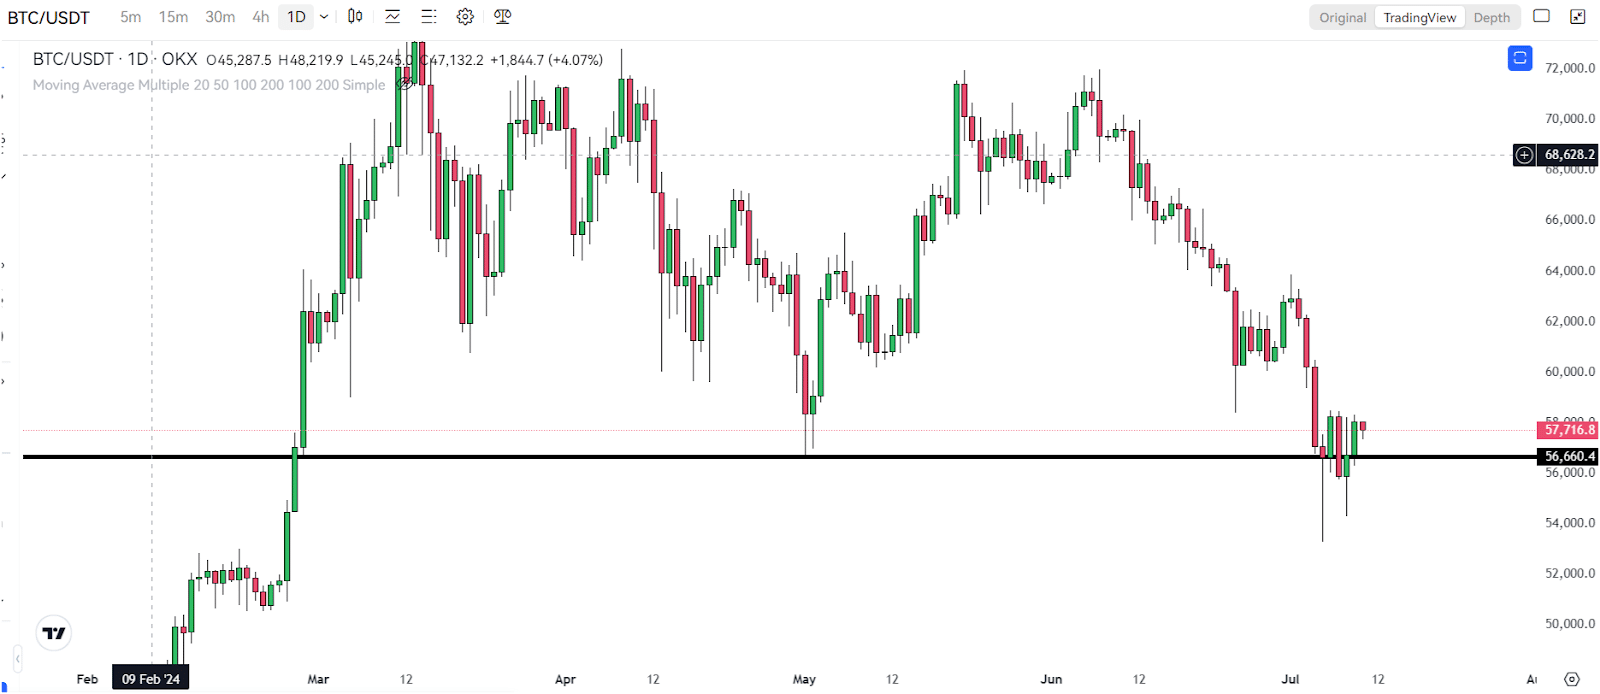
The recent trading above support levels is a positive sign for Bitcoin, suggesting some stabilization after a volatile period. This finding of a potential bottom is encouraging, but staying cautious is important as the market’s future direction remains uncertain.
Relative Strength Index (RSI)
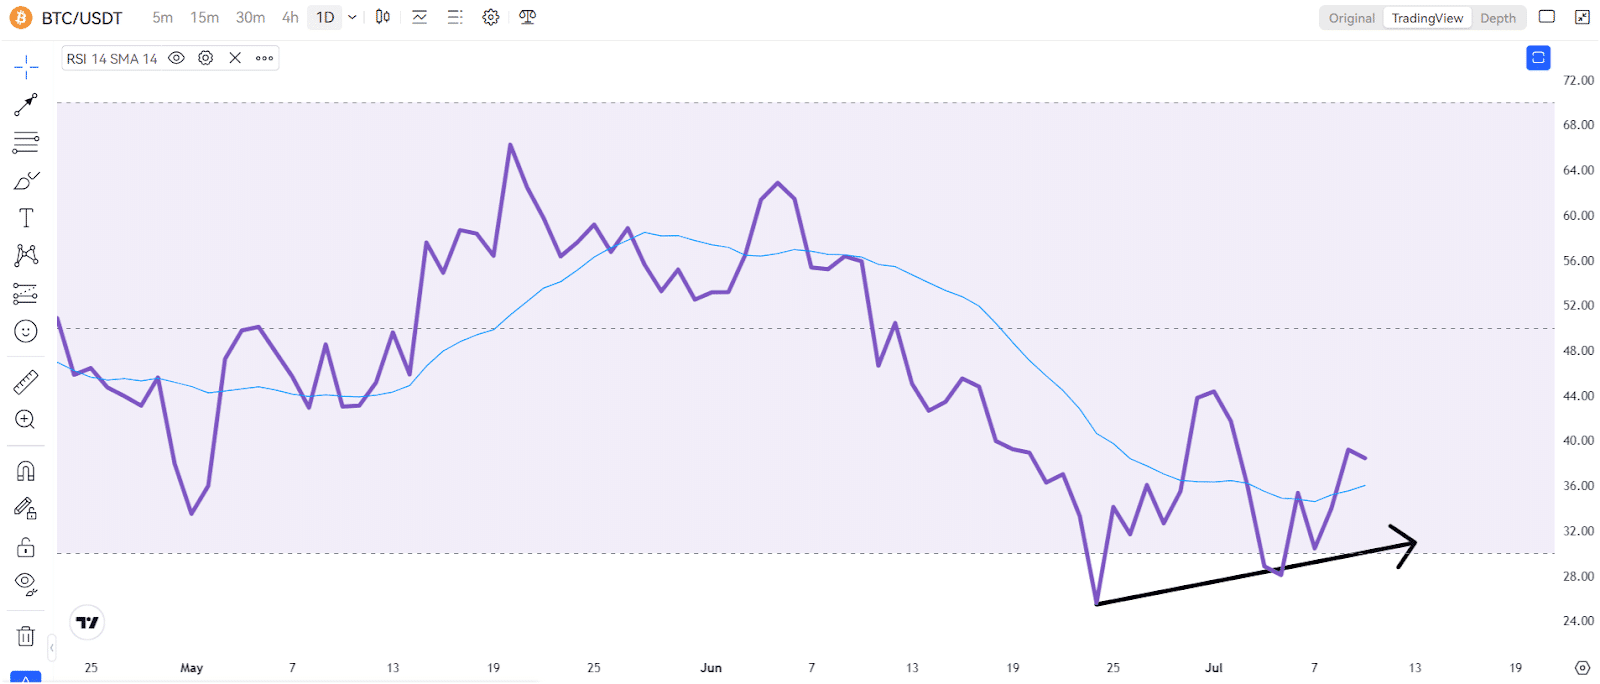
The RSI is now above neutral levels, indicating potential bullish momentum. The bullish divergence on the daily timeframe adds to this positive sentiment. This is another sign that the market might be turning around, but caution is still advised.
Moving Average Convergence Divergence (MACD)
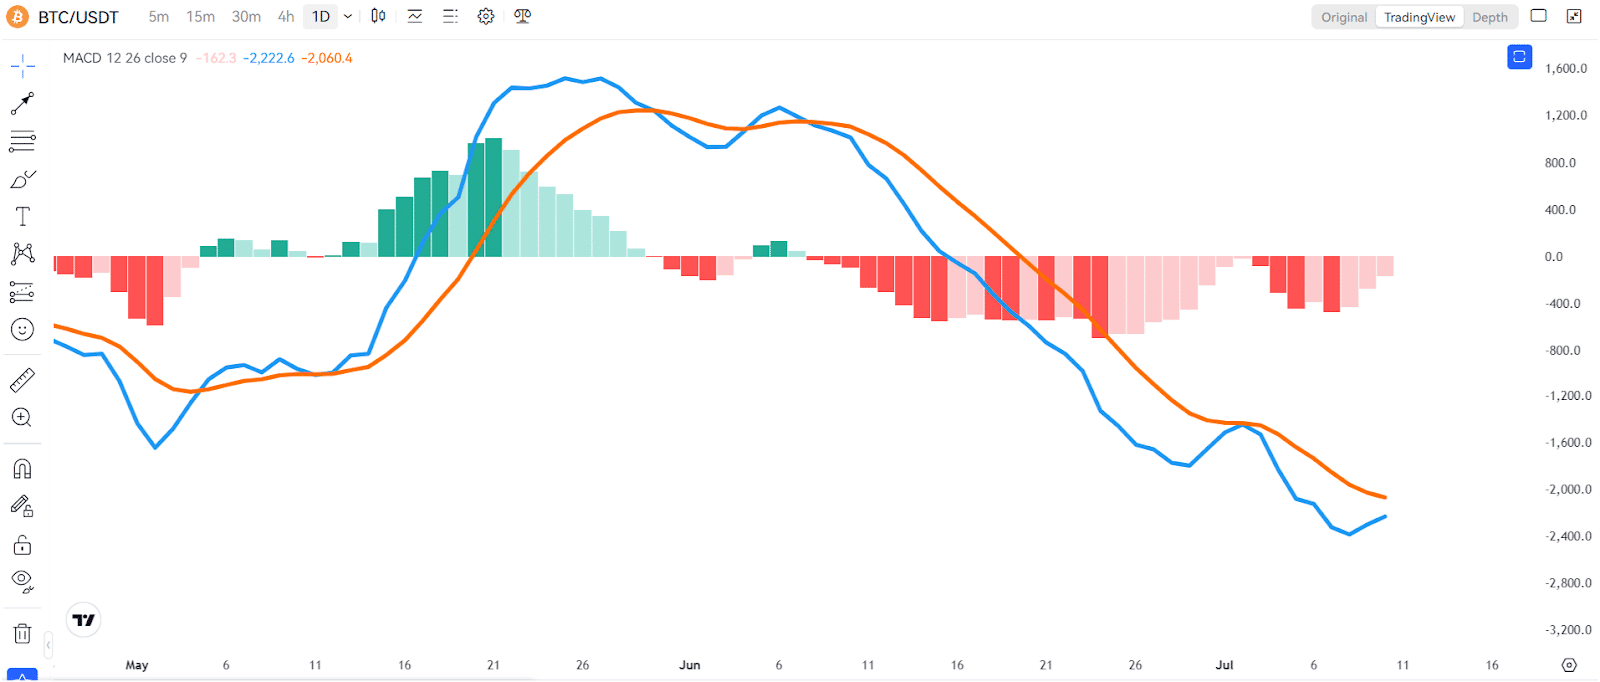
Although still in negative territory, the MACD shows signs of a crossover. A bullish crossover, where the MACD line crosses above the signal line, could signal a new uptrend in the market. However, it’s important to note that the MACD is still negative, so caution is still warranted.
Notcoin (NOT)
RSI & Momentum
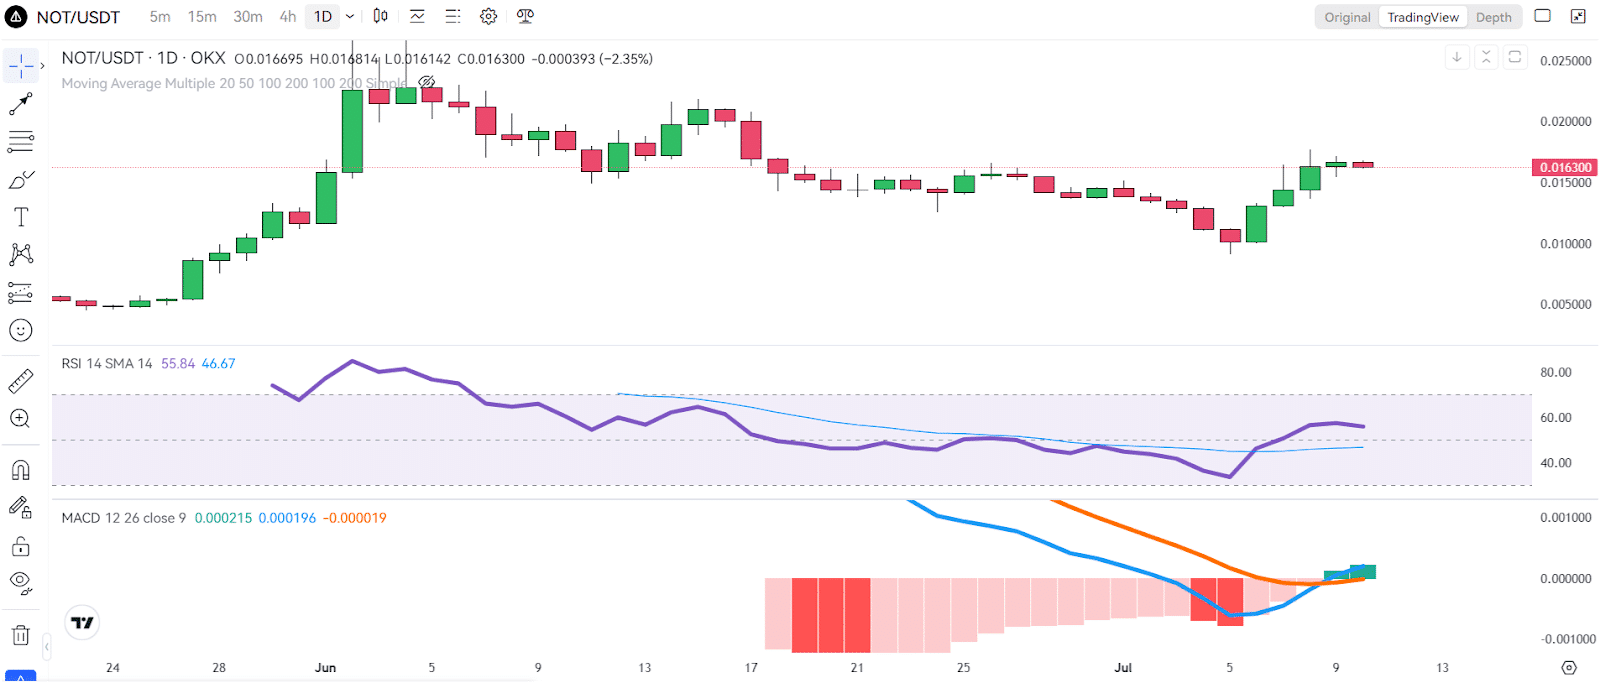
The Relative Strength Index (RSI) is already above neutral levels, suggesting that NOT is not overbought and has room for growth. Additionally, the upward curve of the Moving Average Convergence Divergence (MACD) indicates that NOT has positive momentum, which means its price will likely continue increasing.
Resistance Levels
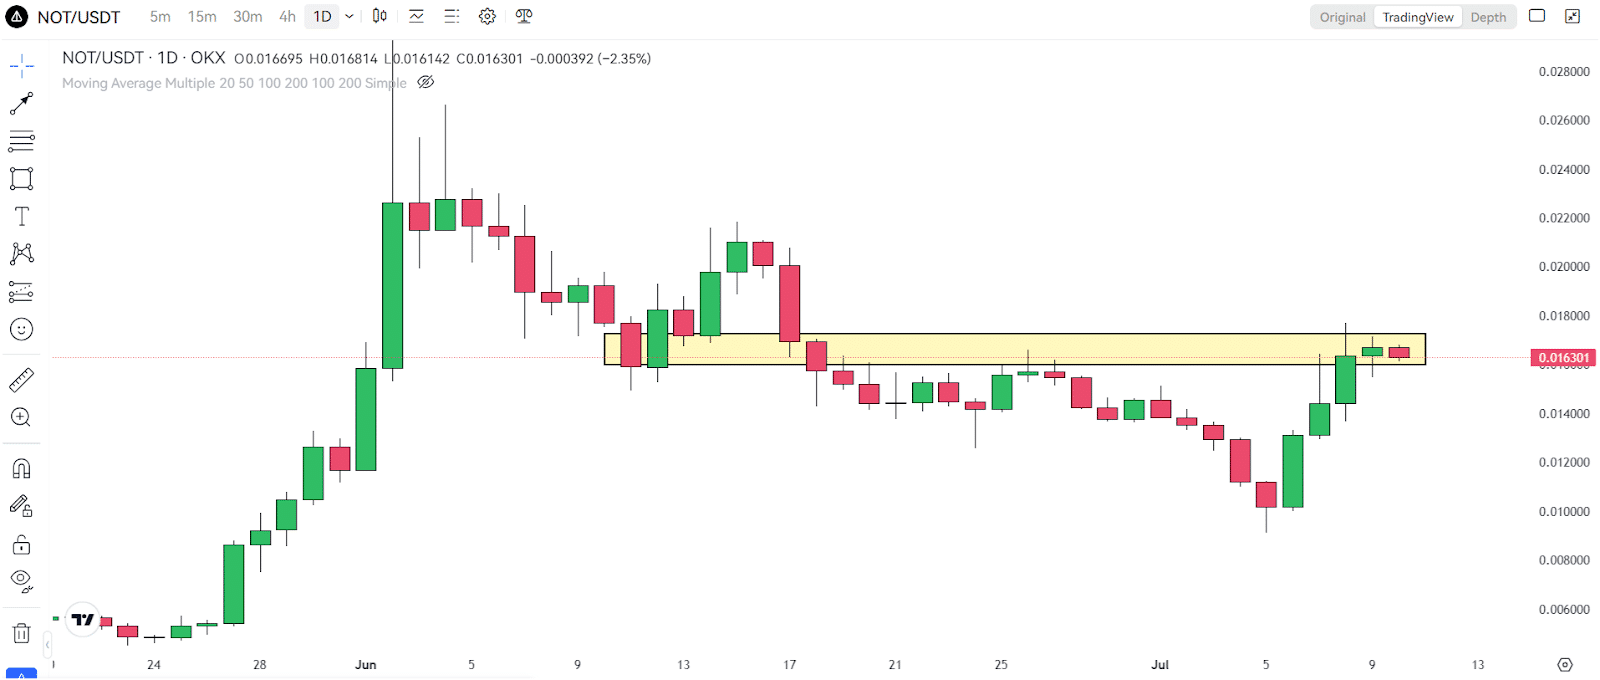
Keep an eye on NOT’s resistance levels. If it breaks through, it could drive prices higher. However, be cautious, as resistance can also lead to price reversals.
Final Thoughts
For more in-depth technical analysis like this one, make sure to subscribe and hit the notification bell on UseTheBitcoin’s YouTube channel. We post daily videos covering the crypto markets, so don’t miss out!


