Key Takeaways:
- Bitcoin fell below $69,000, wiping out gains accumulated since November 2021
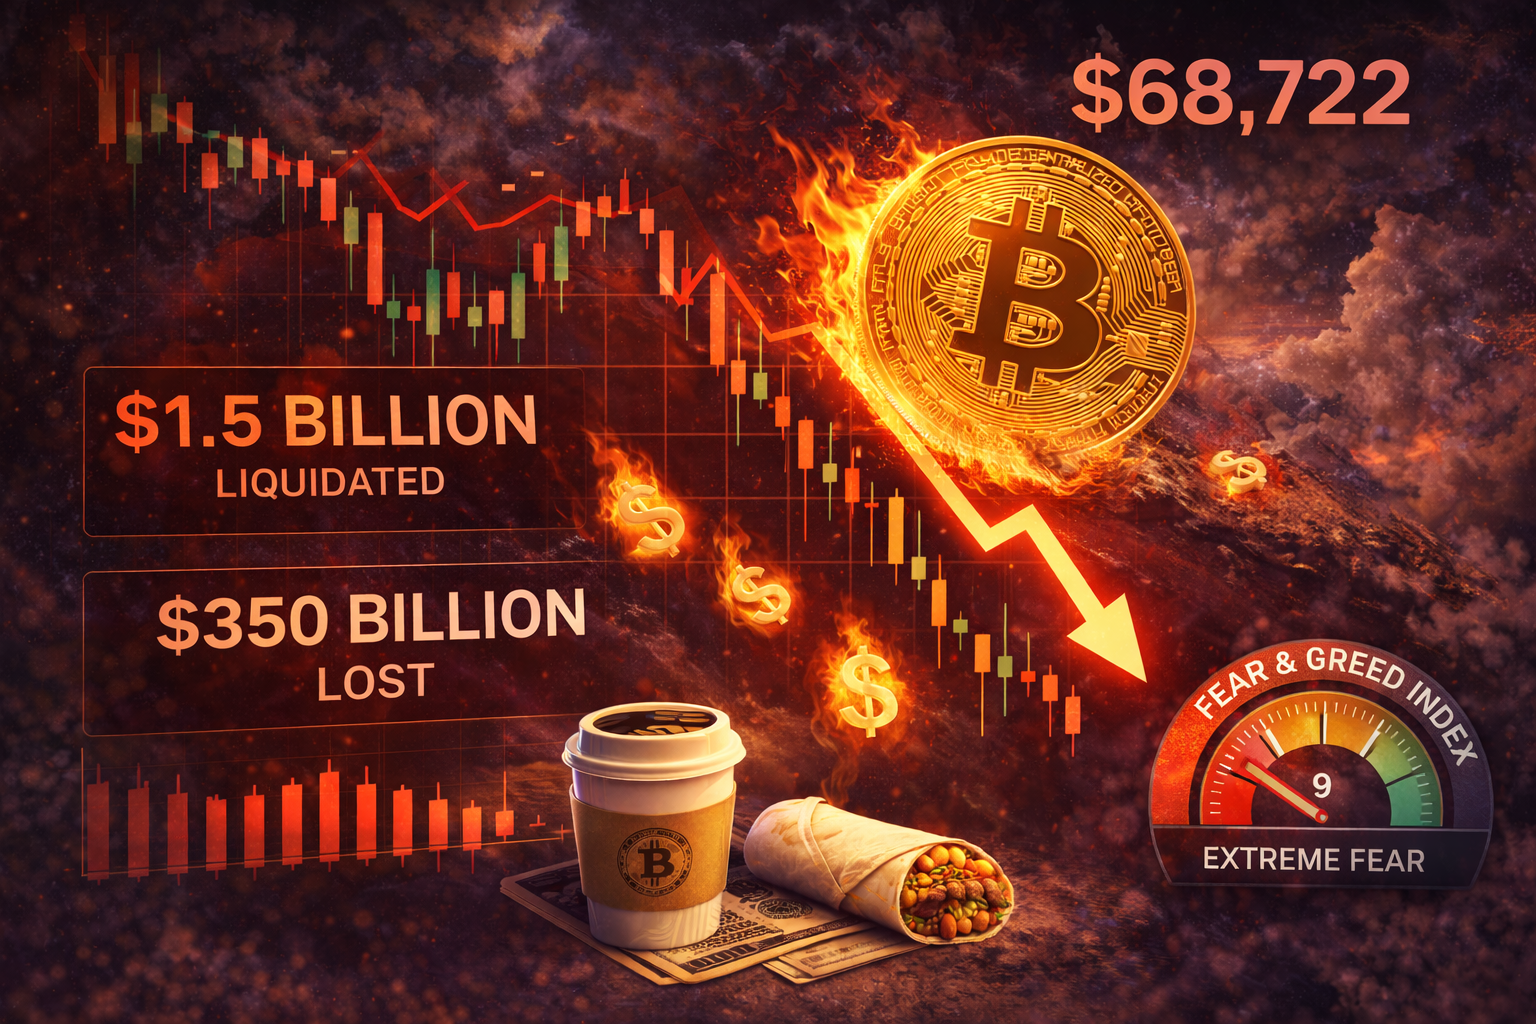
- Over $1.5 billion in crypto liquidations occurred in 24 hours
- The crypto market cap dropped by $350 billion in a single day
Bitcoin crash below its November 2021 all-time high of $69,000, erasing years of gains. The crypto market lost over $1.5 billion in liquidations within 24 hours. Trading data shows 11 consecutive red 4-hour candles, a pattern rarely seen even during major market crashes. The Fear and Greed Index hit 9, signaling extreme fear among investors.
How Severe Is This Bitcoin Selloff?
The selling pressure reached unprecedented levels across major exchanges. Bitcoin recorded 11 straight red 4-hour candles, a streak that surpasses even the most dramatic historical crashes. The 2020 COVID crash didn’t produce this many consecutive down candles. The 2022 LUNA collapse showed less sustained selling. Even the 2021 bear market crash had shorter red streaks.
Historical data shows the previous record was 14 consecutive down candles in 2019. Current market conditions are approaching that extreme. The sustained downward pressure indicates strong conviction among sellers rather than random panic.
Coinbase experienced concentrated selling activity over the past six hours. More than 19,000 BTC traded on the platform during this period. This volume exceeds the October 10 selloff that previously marked a significant downturn. The unprecedented trading activity on a single exchange suggests institutional involvement rather than retail panic.
The Coinbase Premium Index plunged deep into negative territory. This metric tracks the price difference between Coinbase and other exchanges. Negative readings indicate stronger selling pressure from U.S.-based institutional investors. The chart shows the premium hitting levels not seen since previous major market bottoms.
What Do Market Sentiment Indicators Show?
The Fear and Greed Index dropped to 9, marking extreme fear in the market. This indicator combines multiple data points including volatility, market momentum, and social media sentiment. Readings below 10 historically signal capitulation events where investors give up hope.
Bitcoin traded at $61,665 when the index hit extreme fear levels. Previous extreme fear readings often preceded market bottoms. However, the index can remain in extreme fear territory for extended periods during bear markets.
The broader crypto market hemorrhaged $350 billion in market capitalization within 24 hours. This loss affected all major cryptocurrencies beyond just Bitcoin. Ethereum fell 17.67% during the same period. XRP dropped 23.90%, while Solana declined 23.17%.
Altcoins suffered even steeper losses as investors fled to perceived safety. Smaller cap tokens experienced double-digit percentage drops across the board. The selling spread uniformly across all sectors of the crypto market.
What Does CoinMarketCap’s Research Team Analysis Reveal?
CoinMarketCap’s Research team conducted analysis using four key on-chain indicators to assess whether Bitcoin reached a bottom. Their examination focused on metrics that historically signal major market turning points.
The Net Unrealized Profit/Loss (NUPL) metric tracks the difference between market cap and realized cap. This indicator shows whether holders are sitting on profits or losses. NUPL readings in the capitulation zone typically mark market bottoms. Current readings suggest many holders now face significant unrealized losses.
The MVRV Z-Score compares market value to realized value using standard deviation bands. Extreme low readings on this metric have historically coincided with major buying opportunities. The research team noted current Z-Score levels approaching historical bottom territory.
HODL Waves analysis reveals the age distribution of Bitcoin holdings. Long-term holders typically accumulate during bear markets while short-term holders capitulate. The current wave pattern shows increasing concentration among long-term holders. This shift indicates experienced investors are absorbing supply from weaker hands.
The Fear and Greed Index reading of 9 confirms extreme fear levels. CoinMarketCap’s team emphasized that while this signals potential bottom formation, it doesn’t guarantee immediate recovery. Markets can remain oversold longer than expected.
Where Is the Selling Coming From?
Institutional selling through regulated U.S. exchanges drives much of the current pressure. The concentration of volume on Coinbase suggests professional traders and institutions are reducing positions. Retail investors typically spread trades across multiple platforms.
Leveraged positions faced massive liquidations as prices fell. Traders using borrowed funds to amplify gains got caught in cascading liquidations. Exchange data shows long positions worth over $1.5 billion got forcibly closed. These automatic selling events accelerated the price decline.
The sustained red candle pattern indicates methodical selling rather than panic dumps. Someone or multiple entities are consistently selling into the market every four hours. This pattern suggests planned liquidation of large positions rather than emotional reactions.
Market makers and algorithmic traders amplify moves in both directions. When selling accelerates, their systems automatically adjust to the momentum. This creates feedback loops where initial selling triggers more selling through automated systems.
How Does This Compare to Previous Crashes?
The current selloff shows unique characteristics compared to historical crashes. The 2020 COVID crash happened rapidly with sharp wicks and quick recovery. Current conditions show steady sustained pressure without significant bounces.
The 2022 FTX collapse triggered contagion across multiple protocols. That crash stemmed from fundamental failures in algorithmic stablecoin design. Current selling appears more related to macroeconomic factors and profit-taking.
Bitcoin’s five-year performance still shows significant gains despite recent losses. Since early 2021, Bitcoin returned 73% compared to gold’s 164% and the Nasdaq’s 82%. The S&P 500 gained 75% over the same period. Bitcoin is down nearly 30% year-to-date in 2026.
Previous bear markets saw Bitcoin decline 80-90% from peak to trough. Current losses from all-time highs remain less severe than those historical drawdowns. However, the speed and consistency of recent selling concerns many analysts.
What Should Investors Watch Next?
On-chain metrics will provide early signals of trend changes. The NUPL indicator entering deep capitulation would suggest maximum pain for holders. Recovery typically begins when this metric stabilizes and starts climbing.
Crypto wallet activity from long-term holders offers clues about bottom formation. When experienced investors stop selling and begin accumulating, it signals confidence in lower prices. Blockchain data shows these patterns clearly through wallet age analysis.
Exchange inflows and outflows reveal investor intentions. Large outflows to self-custodial wallets indicate holders plan to wait out volatility. Continued inflows suggest more selling pressure ahead as investors prepare to liquidate positions.
The Fear and Greed Index rarely stays at extreme levels indefinitely. A move back above 20 would signal initial fear reduction. However, sustainable recoveries typically require the index to climb above 40-50 range.
Macroeconomic factors will influence crypto markets significantly. Federal Reserve policy, inflation data, and traditional market performance all affect Bitcoin prices. Crypto markets no longer trade independently of broader financial conditions.
Frequently Asked Questions
Why did Bitcoin drop below $69,000?
Bitcoin fell due to sustained selling pressure concentrated on major exchanges like Coinbase. Over $1.5 billion in leveraged positions got liquidated. The market recorded 11 straight red 4-hour candles.
Is this the Bitcoin bottom?
CoinMarketCap’s research team analyzed four key indicators that suggest potential bottom formation. However, extreme fear can persist for extended periods. Markets may need more time to stabilize.
How much did the crypto market lose?
The total crypto market cap dropped $350 billion in 24 hours. Bitcoin fell below its November 2021 high of $69,000. Major altcoins like Ethereum and Solana declined 17-23%.
What is the Fear and Greed Index showing?
The index hit 9, indicating extreme fear in the market. Readings below 10 typically signal capitulation events. Historical data shows these levels often precede market bottoms.
Should I buy Bitcoin during this crash?
On-chain indicators suggest potential bottom formation based on NUPL, MVRV Z-Score, and HODL Waves. However, sustained selling pressure and extreme fear suggest caution. Consider dollar-cost averaging rather than trying to time the exact bottom.