
Solana (SOL) is trading above $80 on Monday, July 6, 2026, slightly lower after rallying more than 14% the previous week, with the 100-day EMA at $81.63 capping the rally for now.
What Happened To Solana This Week?
SOL climbed more than 14% last week before running into resistance at the 100-day Exponential Moving Average (EMA), currently sitting at $81.62. The pullback is modest so far, and price remains above both the 50-day EMA at $76.40 and the 50% Fibonacci retracement at $79.23, which together form the nearest support band.
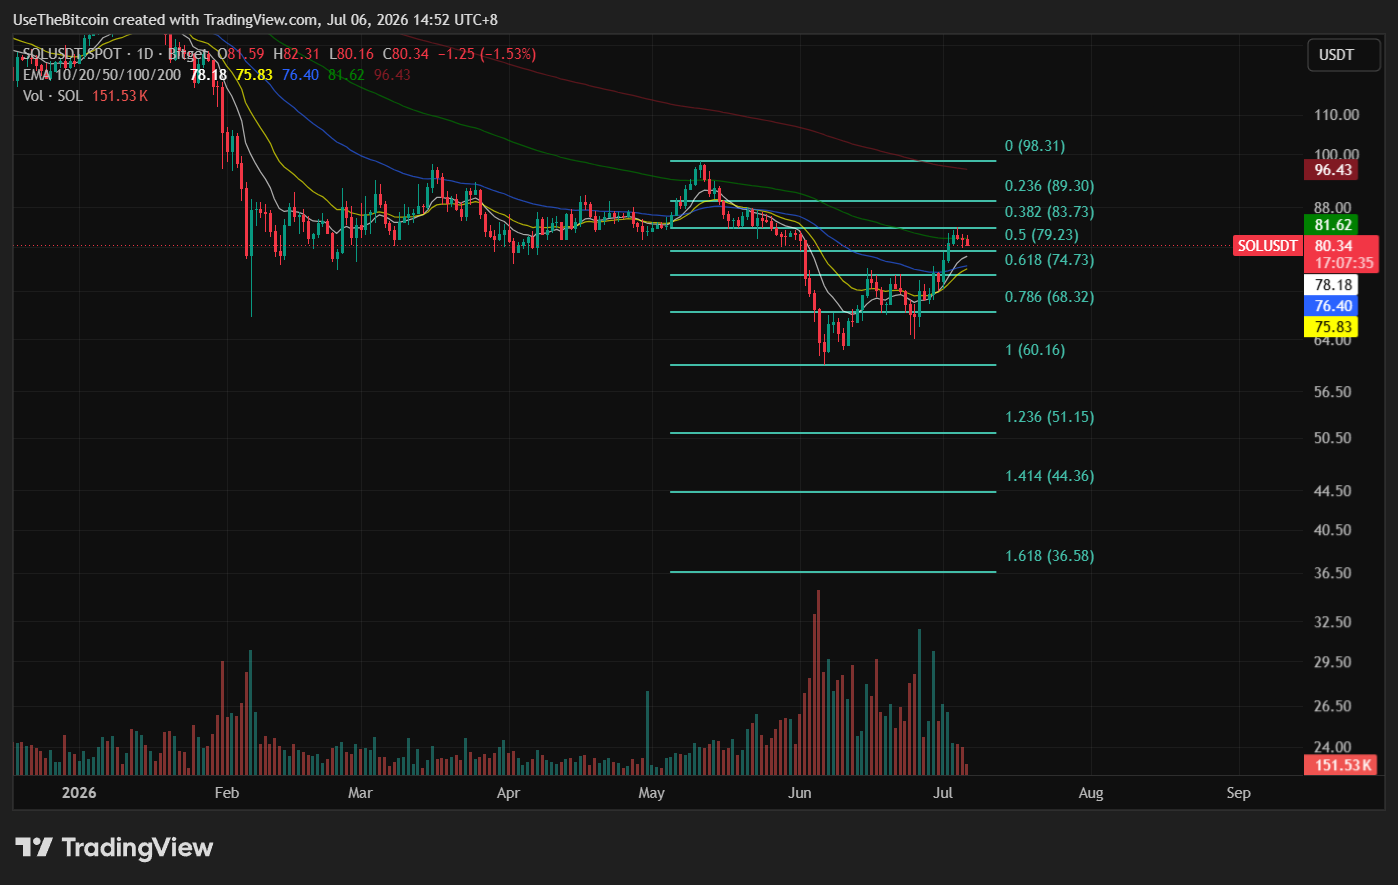
However, with regard to the trading volume, a 24-hour volume drop of 29% to $1.54 billion followed the rally, suggesting last week’s pump lacked the sustained participation typically needed to confirm a breakout. Most of that volume remains concentrated on centralized exchanges, with decentralized exchange activity described as negligible in the same report.
| Level | Role | Notes |
| $60.13–$69.16 | Deeper Fibonacci support | Only relevant on a break below $74.75 |
| $74.75 | 38.2% Fibonacci retracement | Downside target if $76.41 breaks |
| $76.41 | 50-day EMA | Secondary support |
| $77.06 | Horizontal support | Minor cushion above the 50-day EMA |
| $79.27 | 50% Fibonacci retracement | Immediate support |
| $81.63 | 100-day EMA | Current resistance |
| $83.78 | 61.8% Fibonacci retracement | Next resistance above the EMA |
| $90.21 | 78.6% Fibonacci retracement | Target on a confirmed breakout |
| $96.19–$96.73 | Horizontal level and 200-day EMA | Longer-range resistance cluster |
SOL Price Analysis Historical Context
The current setup follows a pattern SOL has repeated several times in 2026, which is a sharp weekly rally followed by a pause at a major moving average rather than a clean breakout.
The prior instance came in late June, when SOL did a similar recovery on optimism about ETF inflows before stalling below the same EMA cluster. The repeated rejection at the 100-day EMA this year has made it a closely watched technical level for SOL traders, since a genuine close above it would be the first since the broader correction earlier this year took SOL well off its highs.
What the Data Shows on Solana’s Current Price
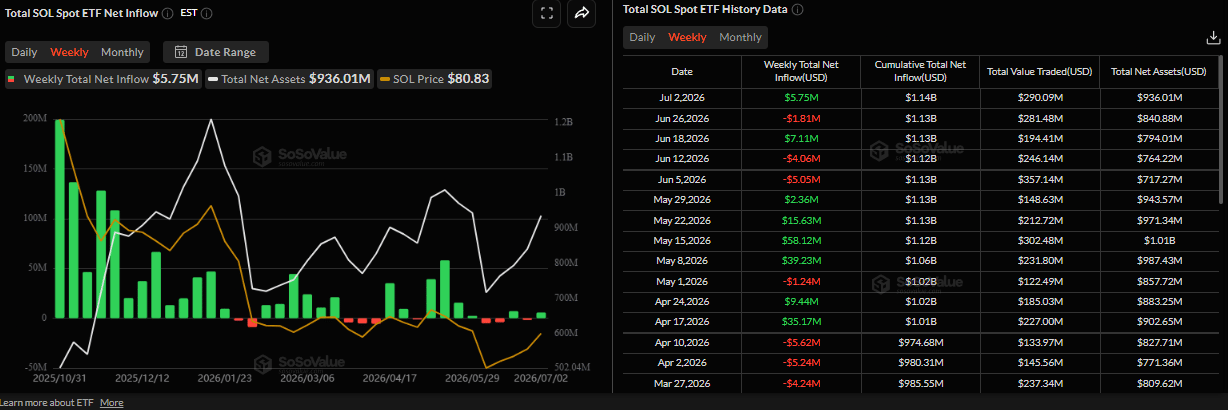
Institutional flows are modestly positive. SoSoValue data show US-listed spot SOL ETFs recorded a $5.75 million inflow the week of June 29, reversing a $1.81 million outflow the week before. That is a small figure relative to the size of the market, and it would need to grow and persist to meaningfully change trajectory on its own.
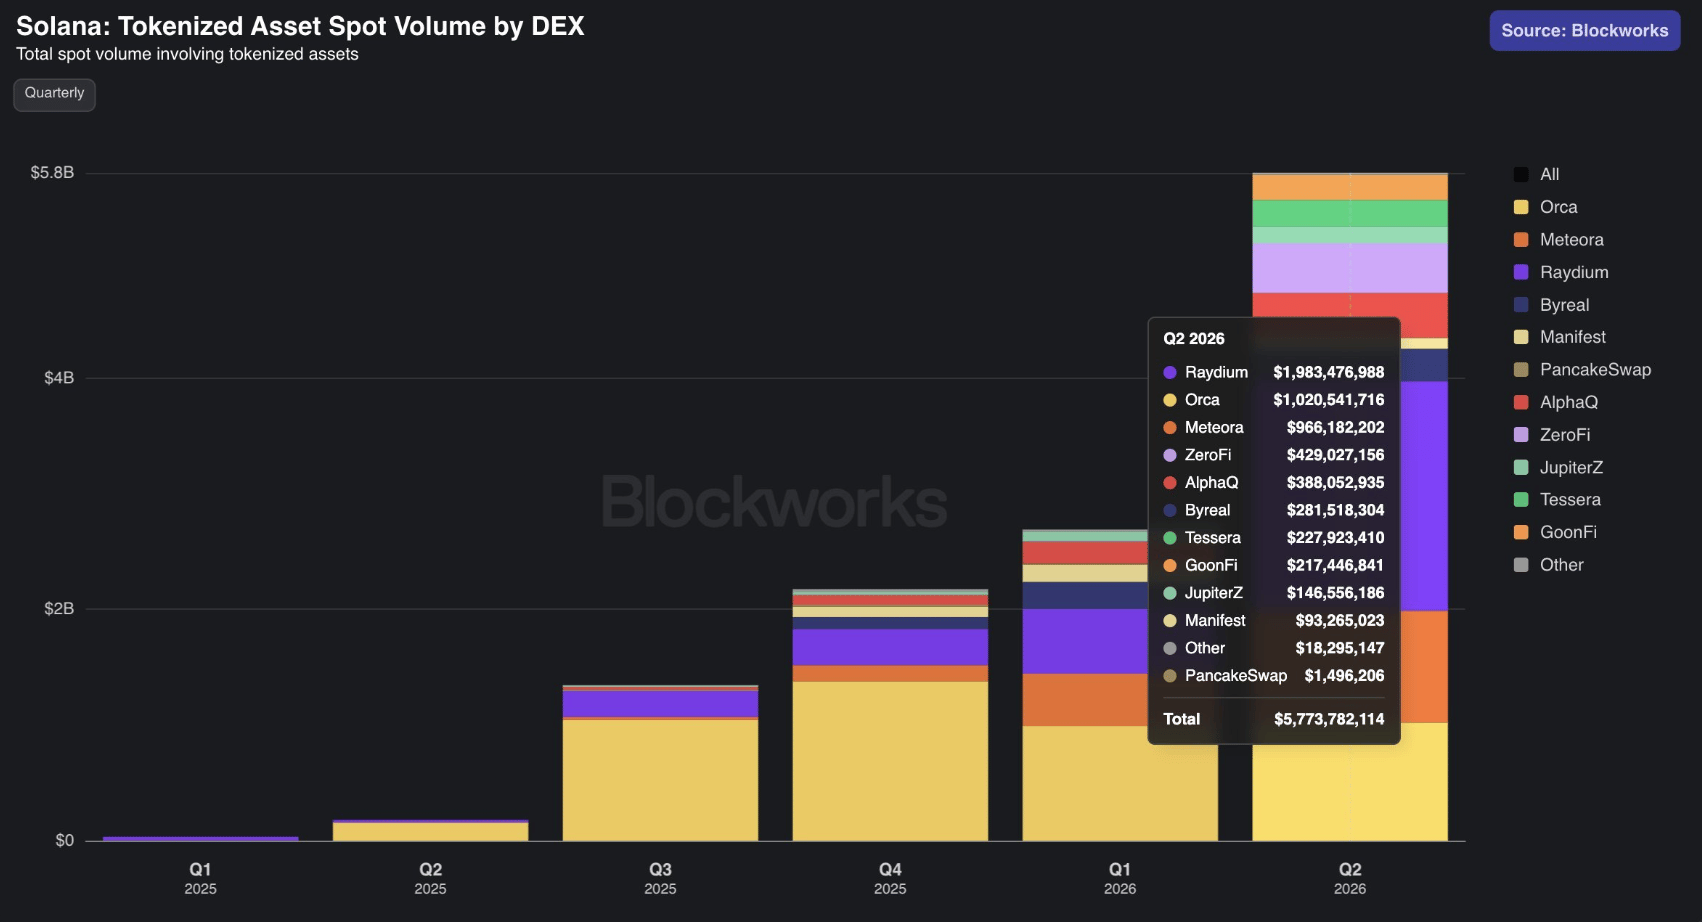
On-chain activity also shows a clearer signal. Solana’s own account posted that tokenized-asset spot volume reached $5.7 billion in the second quarter, up from $2.69 billion in the first quarter, more than doubling in a single quarter.
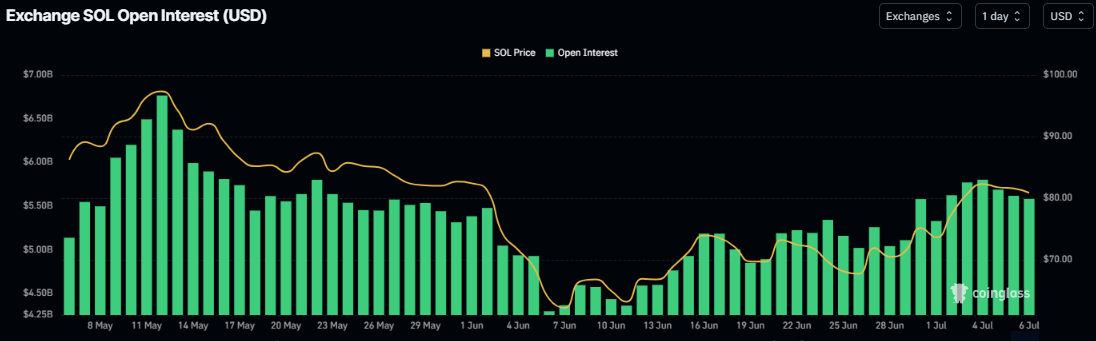
On the derivatives data, futures open interest hit $5.80 billion on Saturday July 4, the highest level since mid-May, before settling near $5.58 billion on Monday July 6.
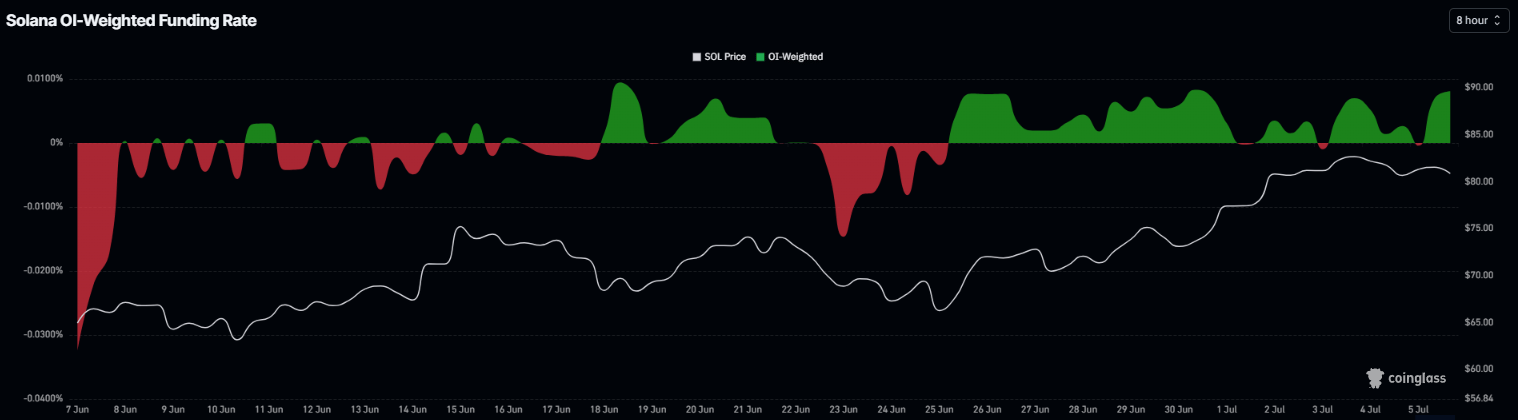
The funding rate turned positive on Sunday July 5, and read 0.0081% on Monday, according to CoinGlass data, meaning long positions are paying short positions, a sign that bullish sentiment currently dominates positioning.
One trade also illustrates how concentrated some of that bullish positioning has become. A trader opened a $21.67 million SOL long position with 20x leverage, according to a post from @TedPillows on X.
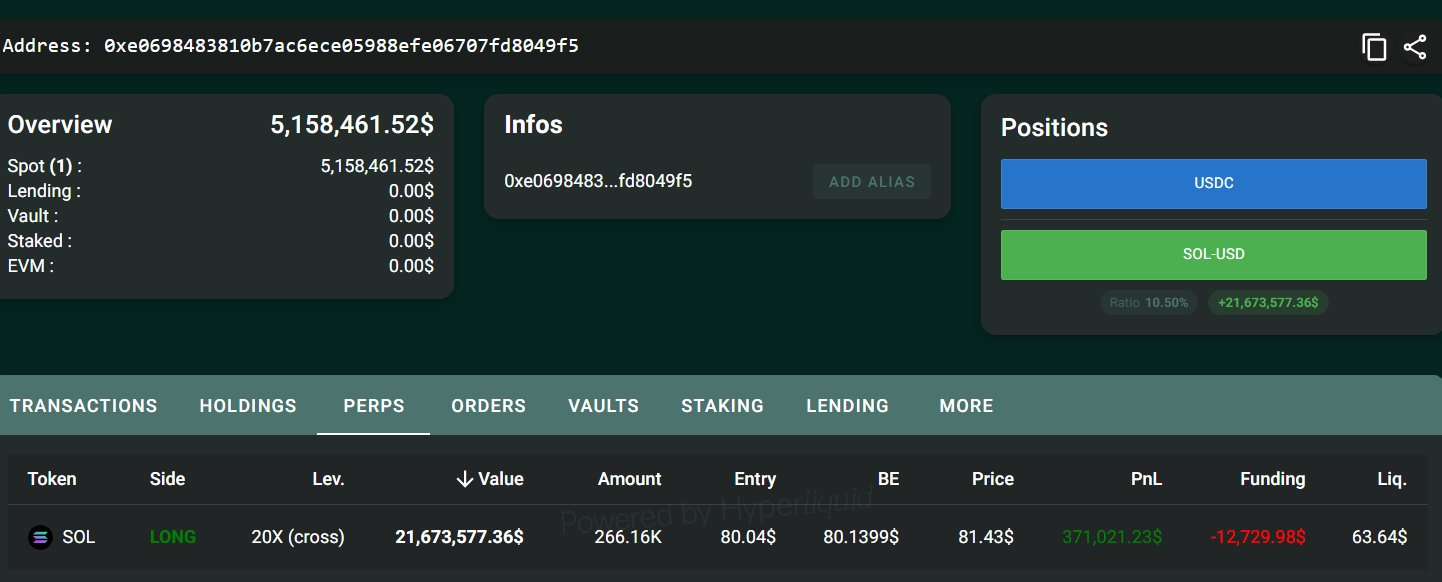
On-chain tracking data shows the position entered near $80.04, was showing an unrealized profit of roughly $371,000 as of the data pulled, and carries a liquidation price of $63.64.
For context, a position of this size at 20x leverage means a roughly 21% drop in SOL’s price from the entry point would trigger liquidation.
The Level That Decides What Happens Next for SOL
A confirmed daily close above the 100-day EMA at $81.63, followed by a push through the 61.8% Fibonacci retracement at $83.78, would open the path toward $90.21 and eventually the 200-day EMA near $96.73.
Failure to clear that resistance cluster keeps SOL range-bound, with the 50-day EMA at $76.41 as the level that must hold to avoid a deeper pullback toward the 38.2% retracement at $74.75. Given the size of leveraged long positioning currently in the market, a break below the $76 to $77 support band could accelerate selling if highly leveraged positions begin to approach liquidation.
For an extensive look at what could shift SOL over a longer horizon, our Solana price prediction for 2030 covers the price targets analysts are tracking, and our guide on Solana ETF approval explains how the exchange-traded fund flows could fit into the bigger institutional picture.
The writer does not hold SOL at the time of writing and publication.
Frequently Asked Questions
Need a refresher? Here are quick answers to what SOL holders are asking most this week.
Why is Solana facing resistance at $81.63?
The $81.63 level is Solana’s 100-day Exponential Moving Average, a widely watched technical indicator. SOL has repeatedly rallied toward this level in 2026 without sustaining a breakout above it, making it a key resistance point that traders are watching for a confirmed daily close.
What is driving Solana’s tokenized asset volume growth?
Solana’s tokenized-asset spot volume more than doubled from $2.69 billion in Q1 2026 to $5.7 billion in Q2 2026, according to Solana’s official account on X. The increase reflects growing on-chain activity and institutional interest in using Solana’s infrastructure for tokenized asset trading.
Is the SOL rally supported by strong volume?
Not entirely. While SOL gained more than 14% over the past week, 24-hour trading volume dropped 29% to $1.54 billion following the rally. A rally on declining volume is typically viewed as a weaker signal than one supported by rising participation.
What happens if SOL breaks below $76.41?
A break below the 50-day EMA at $76.41 would expose the 38.2% Fibonacci retracement at $74.75, with deeper support levels at $69.16 and $60.13 if selling pressure continues. Given the size of leveraged long positions currently in the market, a break of this support band could trigger additional liquidations.
How much SOL ETF inflow happened recently?
US-listed spot SOL ETFs recorded a $5.75 million inflow for the week of June 29, 2026, according to SoSoValue data cited by FXStreet. This followed a $1.81 million outflow the previous week and is considered a modest but positive signal for institutional demand.