Let’s examine the insights shared by our Technical Analyst at UseTheBitcoin as he walks us through his personal trading approach and observations on the crypto market.
Daily Timeframe Analysis
It is frustrating to see Bitcoin right now because, after all the news and hype, it is still moving downwards.
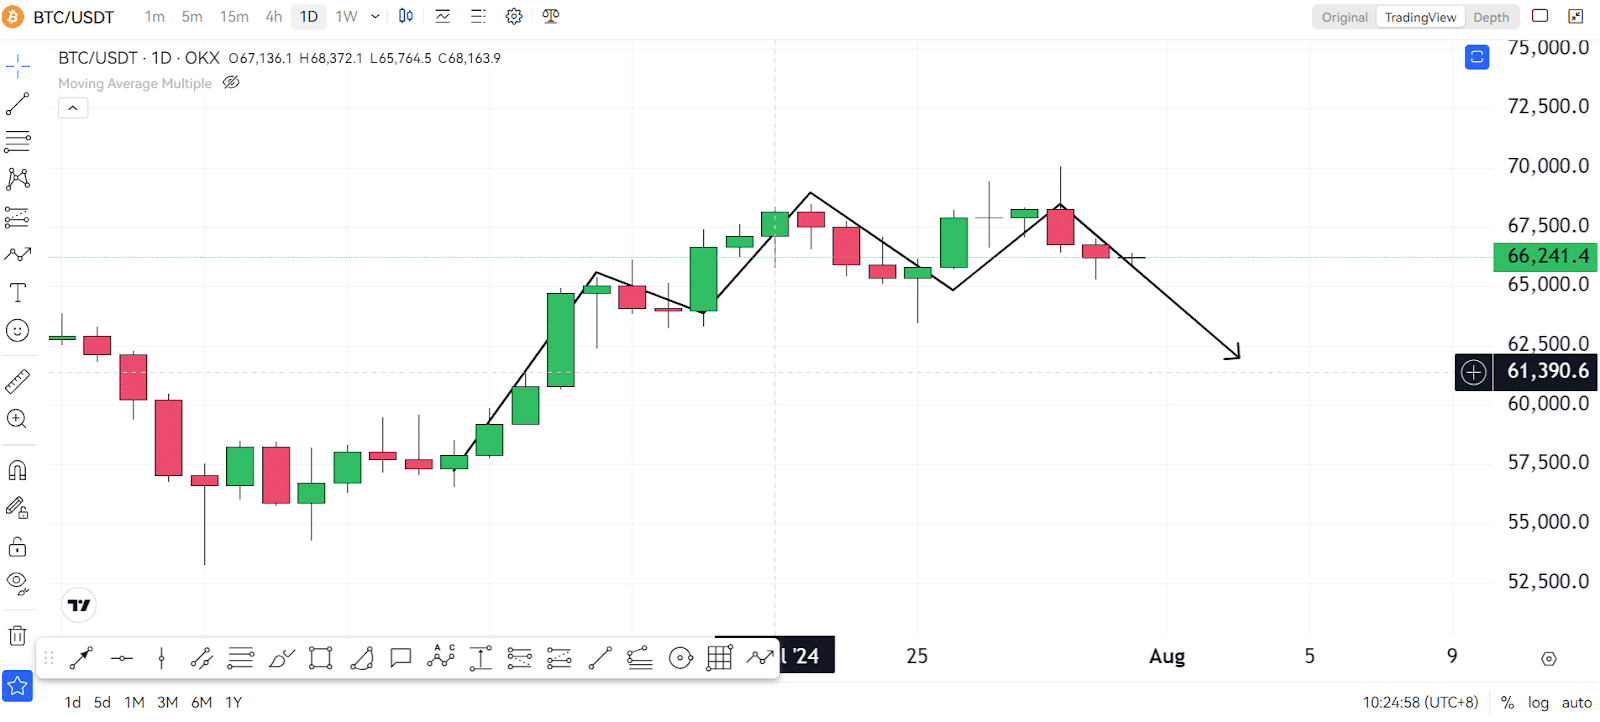
If you look at its daily timeframe, you will notice a head and shoulders pattern, indicating a potential move to the downside.
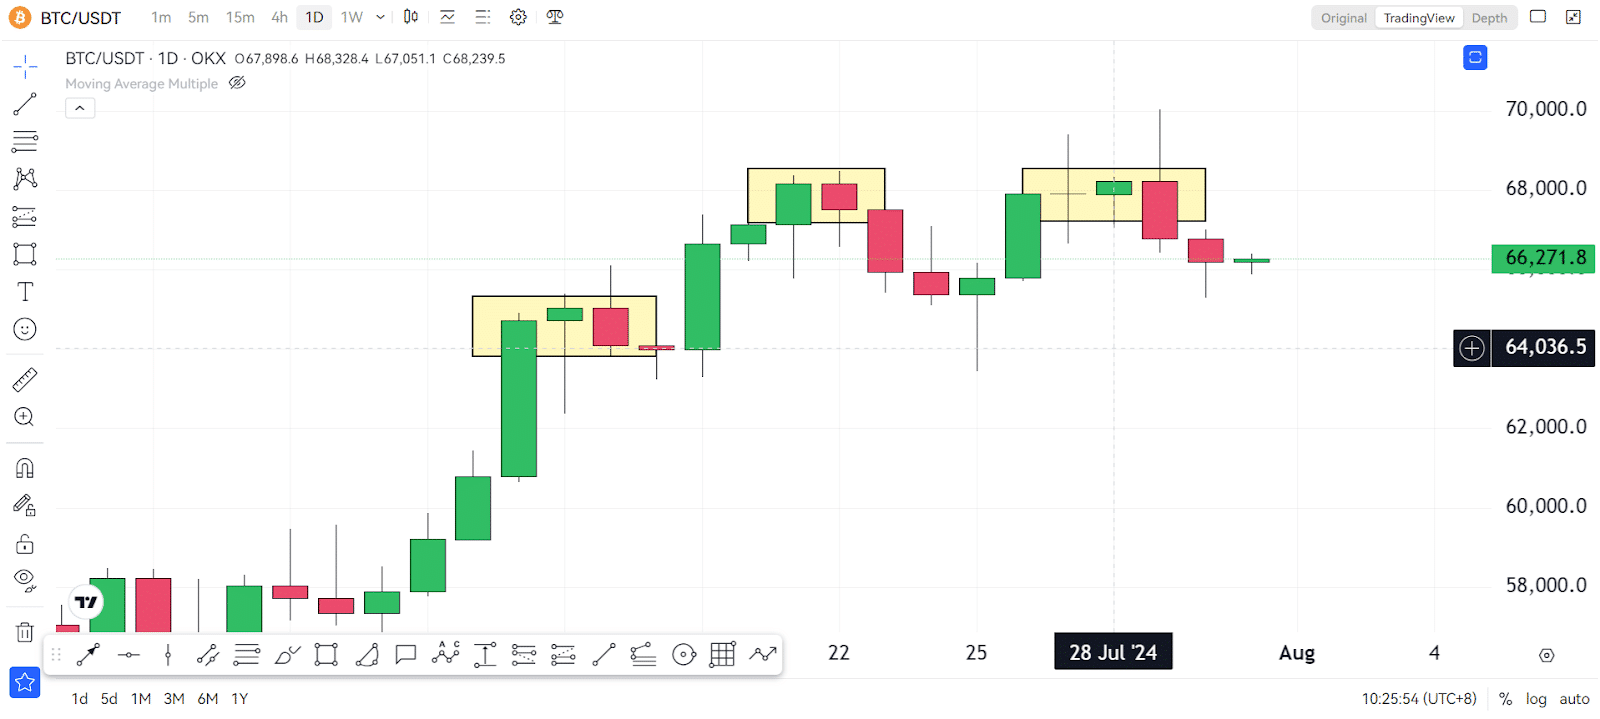
For us to say that we are in a bull trend, we need to see a series of higher highs. But as of now, we are not seeing that, indicating another potential move to the downside.
RSI And Moving Averages
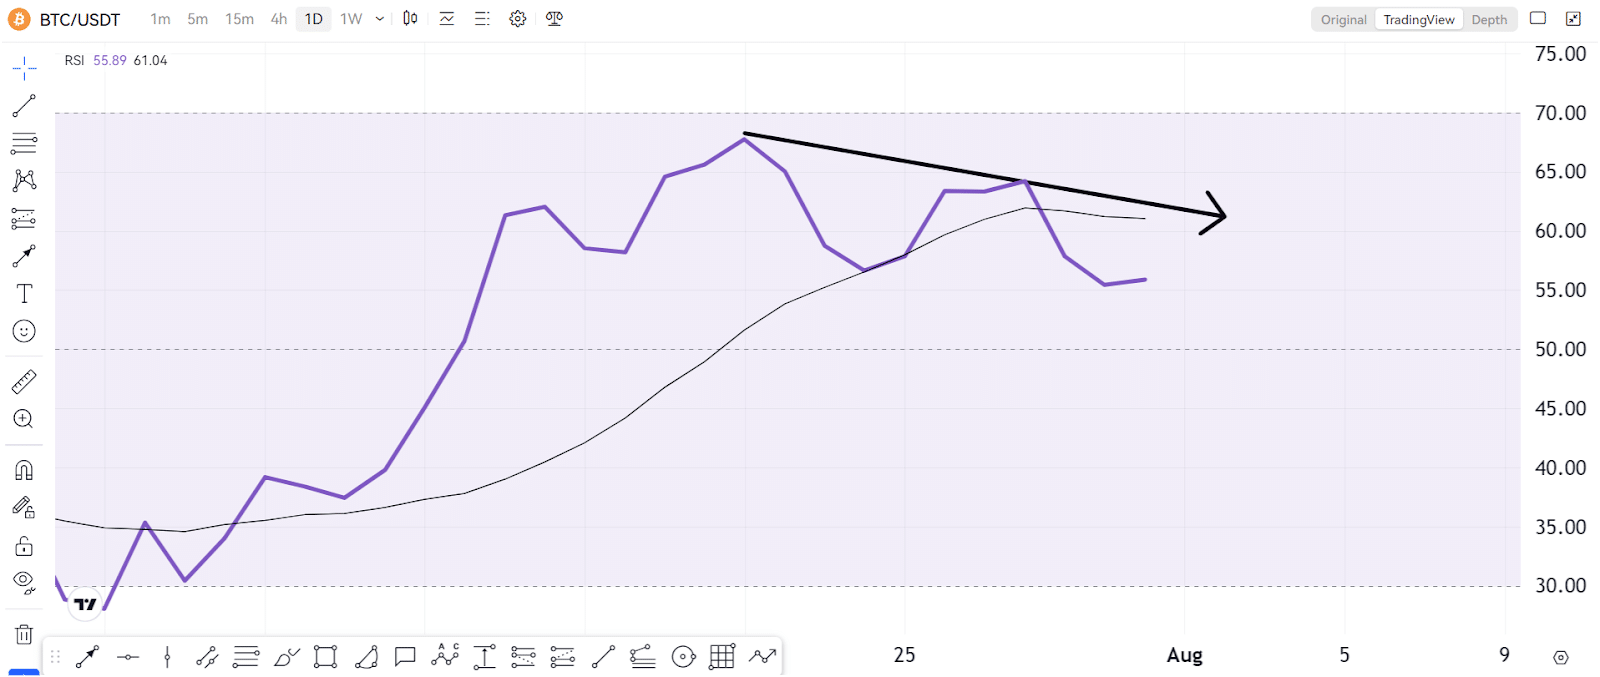
If we check its RSI levels, they are moving downwards again, showing that the buying momentum is slowly fading.
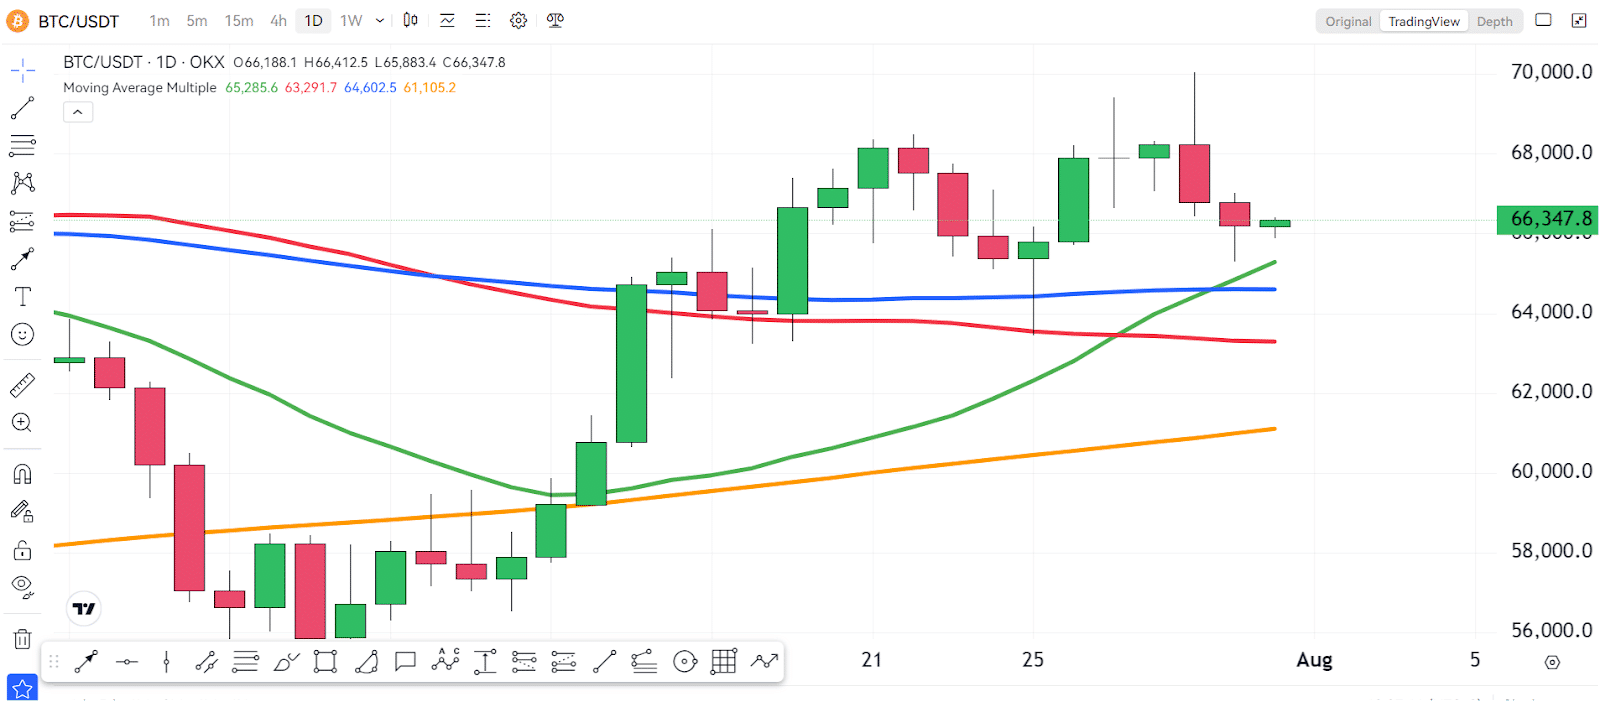
Additionally, if we check the moving averages, they are not in the proper places either, which is another sign pointing to the downside.
Weekly Timeframe Analysis
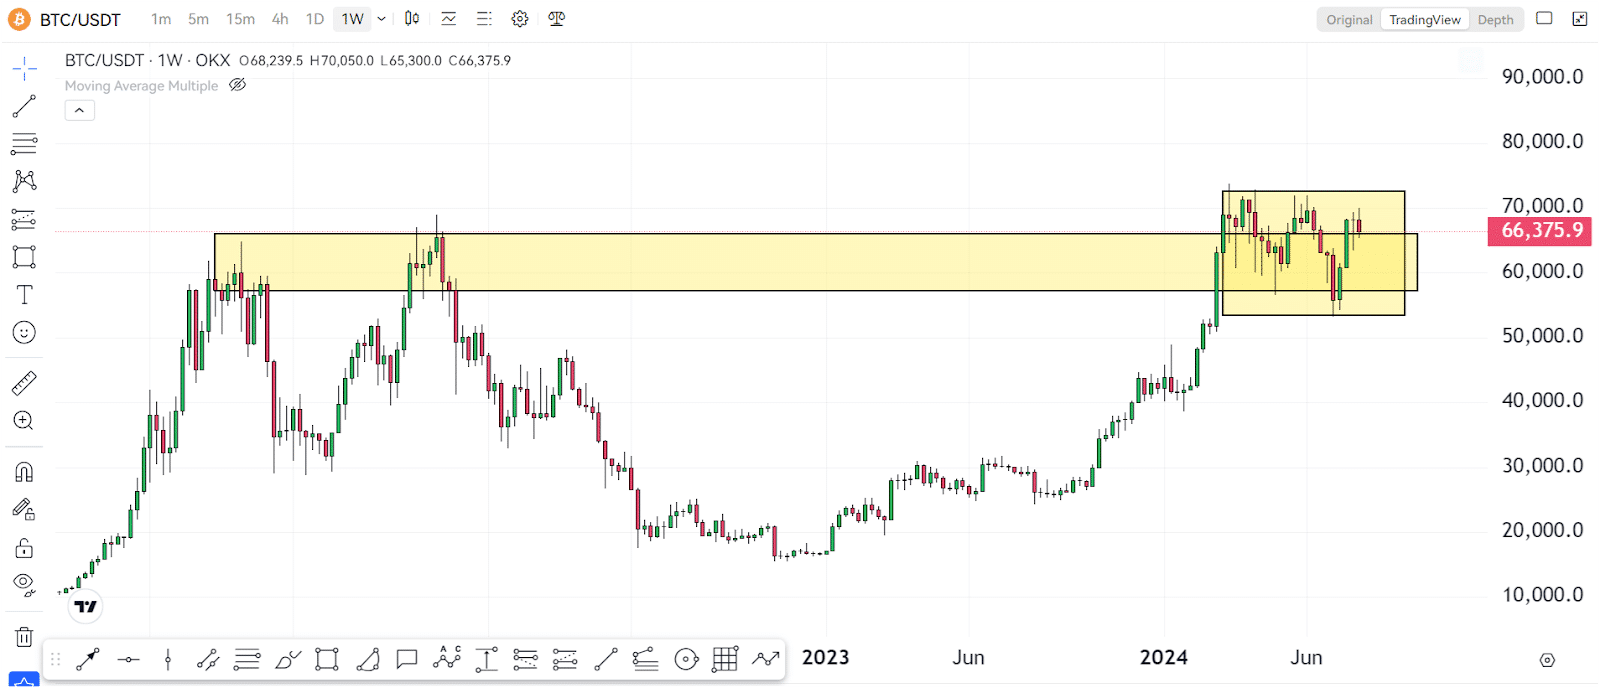
However, looking at the weekly timeframe, you will notice that we are just consolidating above the previous support levels. This means Bitcoin is just saving its energy for the next upward movement.
Weekly RSI
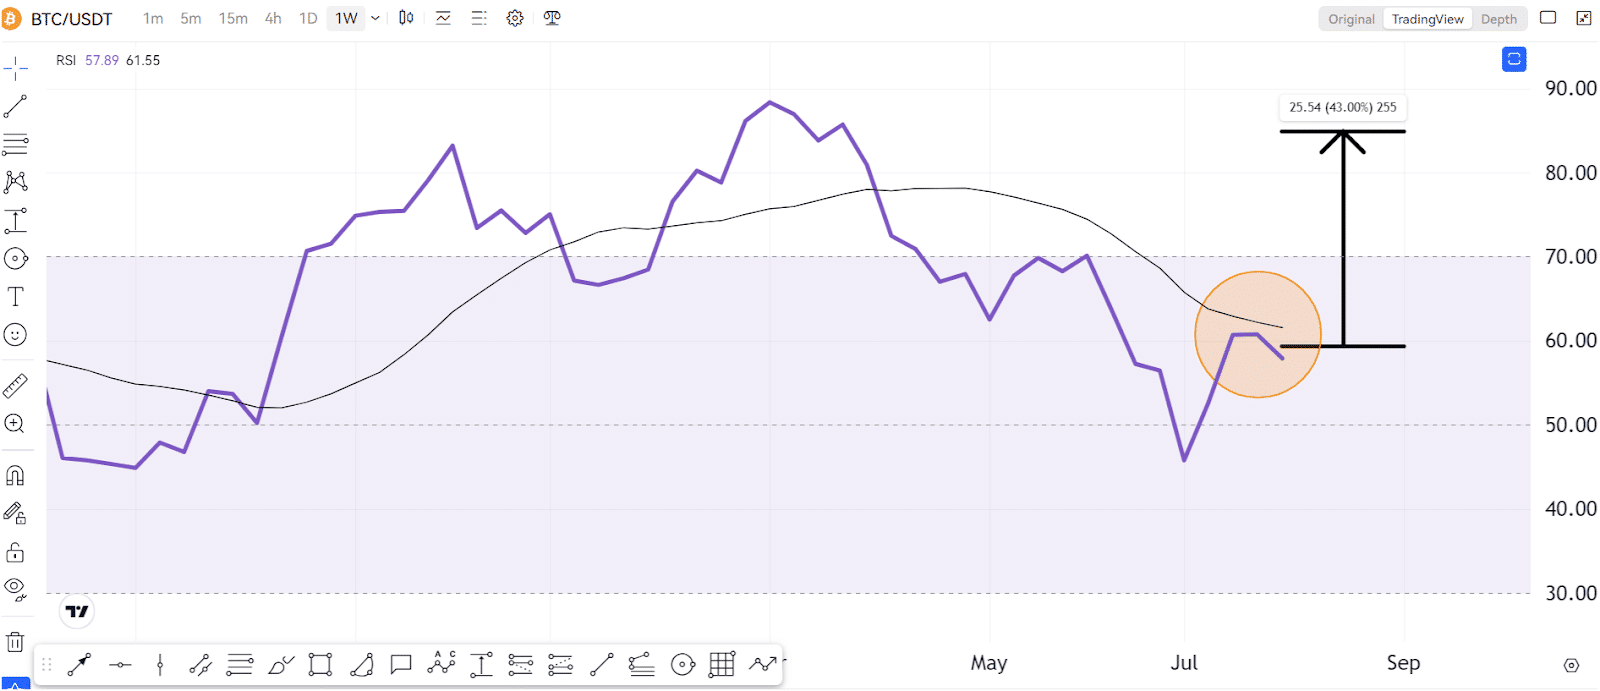
If you check the RSI at the weekly timeframe, you will see that we are far from the overbought levels. We still have a lot of room to grow. We just need to be patient and wait for the market to break out of its consolidation box.
Final Thoughts
In the short term, more signs point downwards in a micro picture. We could see a series of red candles in the next few days or weeks. But in a bigger timeframe, we are still in a bullish sentiment. So just be patient and wait for the proper timing.
For more in-depth technical analysis like this one, make sure to subscribe and hit the notification bell on UseTheBitcoin’s YouTube channel. We post daily videos covering the crypto markets, so don’t miss out!


