Recognizing patterns and understanding market behavior are important when trading. One key concept is the significance of long tails or wicks on candlestick charts. These formations can provide valuable insights into potential price movements.
Importance

A candlestick on a chart represents price action for a specific period, such as an hour or a day. The candlestick’s body shows the opening and closing prices, while the wicks (or tails) indicate the highest and lowest prices during that period. A long tail signifies that the price reached a high or low point but retracted significantly before the period closed.
By theory, prices often revisit these areas of long wicks. These levels are retracement areas and can act as support or resistance. Support levels are where prices stop falling and bounce back up, while resistance levels are where prices stop rising and pull back down.
Plotting And Analyzing Long Wicks

Zooming on your chart and plotting all candles with long wicks can reveal a pattern. Prices frequently revisit these areas as a downward movement hitting previous support levels or an upward movement encountering resistance.
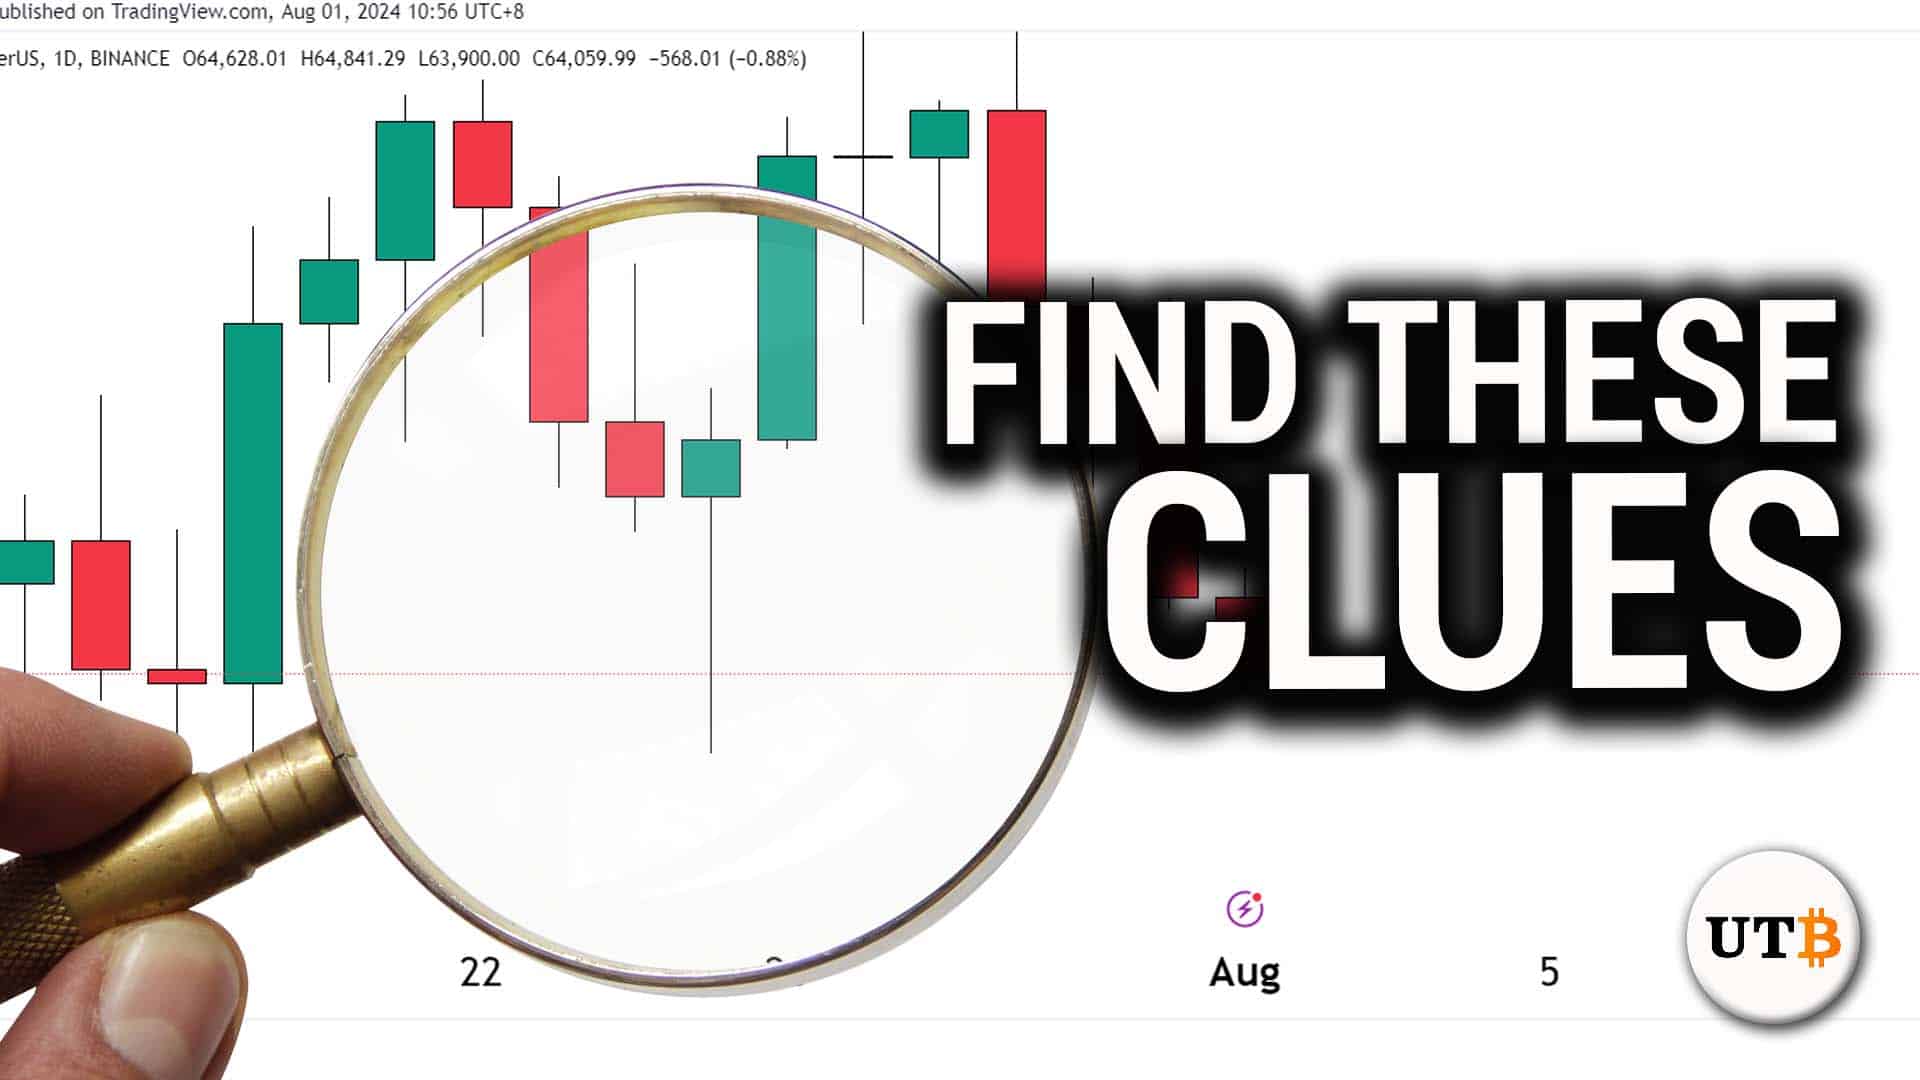
To illustrate this with a practical example, let’s consider Bitcoin’s price movement. By examining historical data, you can identify previous candles with long wicks and observe how prices have interacted with those levels over time.
Bitcoin’s Current Retracement Zone

As of now, Bitcoin’s price is revisiting the tail of a previous candle, indicating we are in a retracement zone. This revisit is a typical market behavior and often signals a period of consolidation. During consolidation, the price fluctuates within a narrow range, building momentum and strength for the next move, typically upwards.
Given this scenario, the best strategy would be to hold cash temporarily and consider buying Bitcoin while it consolidates. Accumulating during this phase positions you to benefit when the market rebounds.
While this approach requires patience and may seem uneventful, it can be highly rewarding. Market cycles involve periods of volatility and calm, and recognizing these patterns helps traders make informed decisions.
Final Thoughts
Understanding retracement areas and the significance of long wicks on candlestick charts can enhance your trading strategy. Applying this knowledge to Bitcoin’s current market behavior allows you to make strategic decisions that align with market trends. Patience and informed trading are important to navigating the market successfully.
For more in-depth technical analysis like this one, make sure to subscribe and hit the notification bell on UseTheBitcoin’s YouTube channel. We post daily videos covering the crypto markets, so don’t miss out!