Key Takeaways
- Ethereum’s price responds to both on-chain fundamentals and broader macro conditions at the same time.
- Key support and resistance levels from historical price action give traders reference points for spotting potential reversals.
- Most analyst models for ETH in 2026 tie long-term price direction to network usage growth and Ethereum’s supply dynamics.
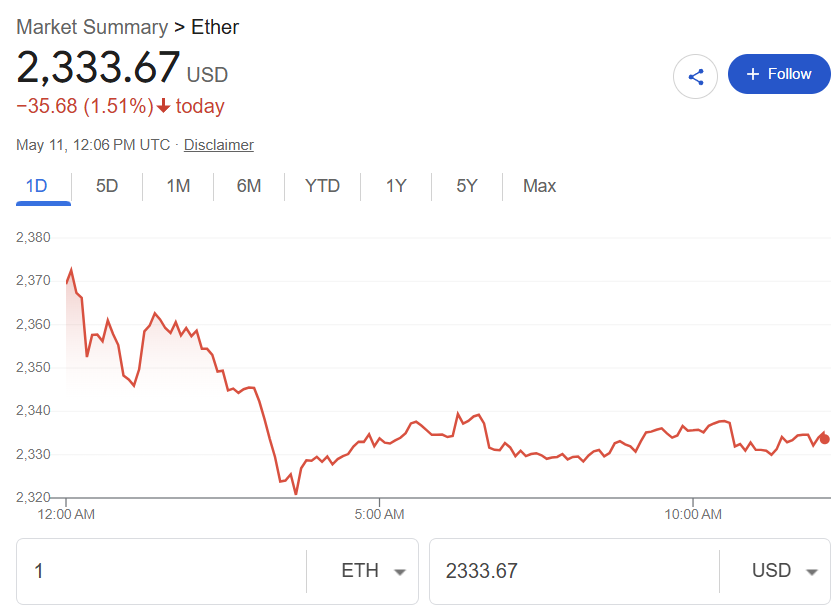
Ethereum sits at the center of decentralized finance and smart contract activity worldwide. Its price does not just reflect speculation, because real network demand, developer activity, and institutional interest all play a meaningful role in shaping where ETH trades at any given moment. Tracking Ethereum price today means looking beyond the number on a chart and paying attention to what is actually driving it.
What Is Currently Driving Ethereum’s Price?
Ethereum’s price responds to a mix of factors that do not always move in the same direction. Strong network activity can push ETH higher even during a cautious macro environment, and a bearish broader market can drag it down even when on-chain metrics look healthy. Understanding both sides of that equation helps investors read price moves more accurately instead of reacting to surface-level signals.
Which On-Chain Signals Are Worth Monitoring?
Several on-chain data points give useful context for where ETH stands at any given moment. These go beyond price and reflect what is actually happening on the Ethereum network itself. Here are the metrics worth tracking on a regular basis:
- Gas fees: Higher average gas fees signal more demand for block space on the network. Rising fees often correlate with increased usage and tend to support ETH’s price over time.
- ETH staked: The amount of ETH locked in the Beacon Chain validator set reflects long-term conviction from large holders. More staked ETH means less circulating supply available for active trading, which affects price dynamics.
- Exchange outflows: When ETH moves off exchanges into private wallets, it typically signals that holders plan to hold rather than sell in the near term. Sustained outflows over days or weeks often precede upward price moves.
- Active addresses: A growing count of daily active addresses suggests the network is attracting new users or seeing rising engagement from its existing base, both of which point to real underlying demand.
Tools like Glassnode and Etherscan provide real-time access to all of these metrics without requiring a paid subscription to get started.
How Do Macro Conditions Affect ETH’s Price?
Ethereum does not trade in isolation from the rest of the financial world. Interest rate decisions from the Federal Reserve, US dollar strength, and institutional risk appetite all influence ETH’s price movement in meaningful ways. When risk assets broadly fall, ETH typically falls alongside them, and when liquidity improves and institutional money returns to growth assets, ETH tends to benefit from that shift.
Bitcoin’s price direction also plays a significant role in ETH’s short-term behavior. ETH frequently follows BTC’s lead during major market moves, particularly to the downside, and this correlation has weakened only gradually over time despite growing ecosystem differentiation.
What Price Levels Are Analysts Most Focused On?
Rather than pointing to a single target, most analysts work with support and resistance zones to frame their market view. These levels come from areas where significant buying or selling previously occurred on the chart, making them reference points that many traders watch at the same time.
Support levels are price floors where buying interest previously halted a decline, and if ETH approaches a strong support zone and holds, it signals that buyers find that price attractive. Resistance levels are price ceilings where selling pressure previously stopped a rally from continuing higher. Traders on platforms like Kraken and Binance commonly use weekly and monthly charts to identify these zones with the most reliability.
The $2,000 level has historically acted as a major psychological floor for ETH. The $4,000 range, marked by the 2021 high and the 2024 rally peak, carries strong overhead resistance. Breaking above resistance with high volume signals genuine momentum, while a rejection at resistance on thin volume points to weakness rather than strength.
What Are Analysts Currently Predicting for Ethereum?
Most analyst price models for Ethereum in 2026 link ETH’s direction to a few specific variables. ETF adoption growth, layer-2 transaction volumes, and overall DeFi activity are the most frequently cited drivers. Bullish models project new all-time highs if institutional flows through ETFs accelerate and network activity hits new records. Conservative models suggest ETH consolidates in a wide range until clearer regulatory frameworks fully take shape.
Ethereum’s post-Merge supply dynamics support the long-term bullish case in a concrete way. Since switching to Proof of Stake, ETH issuance dropped significantly, and the EIP-1559 fee-burning mechanism has kept net supply growth minimal. During high-activity periods, the supply has even turned deflationary, which strengthens the fundamental argument for higher prices over time.
Frequently Asked Questions
Where Can I Track Ethereum’s Live Price?
You can track ETH’s live price on exchanges like Coinbase or Kraken, as well as data aggregators like CoinGecko and CoinMarketCap. These platforms update prices in real time across multiple trading pairs simultaneously.
What Is a Realistic Ethereum Price Target for 2026?
Analyst targets vary widely depending on assumptions. Conservative estimates place ETH between $3,000 and $5,000 in a moderate bull market. More optimistic models point toward $8,000 or higher if institutional ETF flows materialize and network activity reaches record levels.
Does Ethereum’s Price Follow Bitcoin’s Price?
ETH and BTC show strong positive correlation, particularly during major market swings in either direction. However, ETH can diverge meaningfully during periods of strong DeFi or NFT activity that draws attention specifically to Ethereum’s ecosystem rather than the broader market.
How Does EIP-1559 Affect Ethereum’s Supply?
EIP-1559 introduced a fee-burning mechanism where a portion of every transaction fee gets permanently removed from circulation. During high-demand periods, ETH burns faster than new ETH enters the supply, creating deflationary pressure that strengthens the long-term value case for the asset.