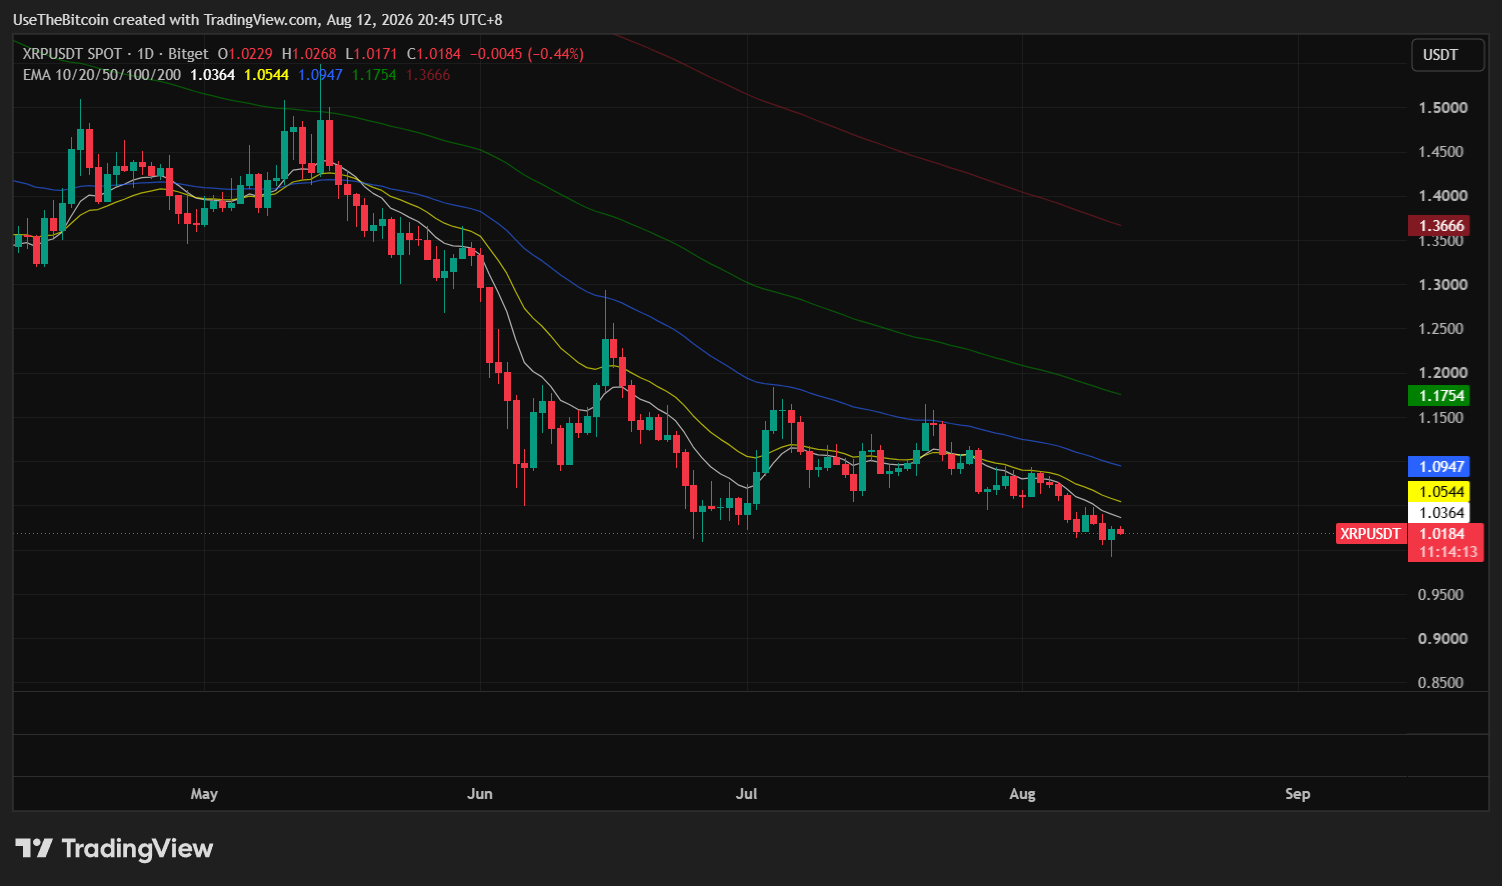
XRP broke below $1 on August 11, 2026, for the first time since 2024, even as a viral call from analyst CryptoBull argues the token is instead setting up for a run to $27 by the end of October.
What CryptoBull Is Predicting
CryptoBull, who has close to 1 million followers on X, posted a chart on August 6 asking what $27 by the end of October would sound like.
The call rests on a weekly channel drawn on XRP’s chart going back to 2024, with three parallel lines, a lower boundary, a middle line at $7, and an upper line at $27.
XRP is currently trading near the lower boundary, which CryptoBull reads as the channel floor and the starting point for the next leg up, with the Stochastic RSI on the same chart turning up from the low 40s as supporting evidence.
The pattern does have some real history behind it. XRP has only touched this lower band three times. In February 2017, XRP fell to $0.0050 and climbed to $3.31 within about a year, a gain of more than 66,000%.
In November 2024, it dropped toward $0.50 and reached $3.40 by January 2025, gaining 580% in roughly three months.
Both prior touches did precede massive rallies, which is exactly why the current call has attracted attention rather than being dismissed outright.
Why the Math Doesn’t Support $27
Reaching $27 from XRP’s current price of around $1.03 would require roughly 31% weekly gains sustained for 12 straight weeks. XRP’s strongest three-month run in recent years, the November 2024 to January 2025 rally, worked out to about 17% a week.
Running that same pace forward from today for twelve weeks lands XRP at almost exactly $7, the chart’s own middle line, not its upper one. XRP’s own historical best-case scenario supports the middle of CryptoBull’s channel, not the top.
Moreover, the market cap math is even harder to get around as XRP currently has 62,676,938,832 tokens in circulation and a market cap of roughly $64 billion. Here’s what that same supply would be worth at a range of price targets:
| XRP Price | Implied Market Cap |
| $2.00 | $125.35 billion |
| $3.00 | $188.03 billion |
| $5.00 | $313.38 billion |
| $7.00 (chart’s middle target) | $438.74 billion |
| $10.00 | $626.77 billion |
| $15.00 | $940.15 billion |
| $20.00 | $1.25 trillion |
| $23.00 (CryptoBull’s August 4 target) | $1.44 trillion |
| $27.00 (CryptoBull’s current target) | $1.69 trillion |
Reaching $27 would push XRP’s market cap to about $1.69 trillion, making it worth 30% more than Bitcoin’s entire market cap right now. That would require something like $1.6 trillion to flow into XRP within 12 weeks.
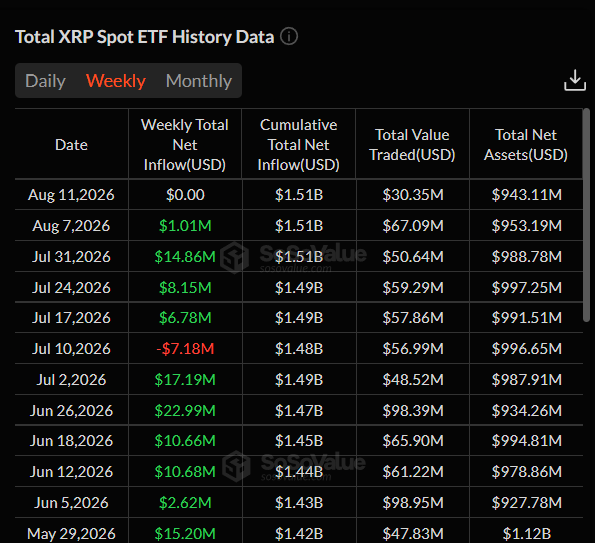
For comparison, US spot XRP ETFs have taken in only about $1 million so far in August, after inflows collapsed from $131.94 million in May to $27.29 million in July.
It’s also worth noting that CryptoBull’s own targets have shifted quickly. In April, the analyst told followers to ignore other analysts calling for $0.73, saying “$28 is next.”
A chart marked $23 followed on August 4, and the $27 target appeared just two days after that. That pattern of moving targets is itself a reason for caution, independent of the underlying chart analysis.
Our earlier coverage of the CLARITY Act’s Senate timeline covers the one legislative catalyst big enough to plausibly move XRP meaningfully, and even that vote is not scheduled until September 15, leaving little time before an October target regardless of outcome.
Why XRP Broke Below $1 in the First Place
XRP’s break below the psychological $1 level on August 11 had several distinct causes rather than one single trigger.
ETF demand has effectively stalled, with only about $1.01 million in net inflows recorded from August 3 to 7, and zero net inflows on both August 7 and August 10 specifically. Bitwise has also separately cut its XRP holdings by $3.58 million on August 6.
At the same time, roughly $8.45 million in XRP positions were liquidated over 24 hours, with longs accounting for 97.6% of that total, a skew consistent with leveraged long positions getting forced out as price broke down rather than the decline being driven by fresh short conviction alone.
In on-chain activity, transactions on the XRP Ledger were falling from around 2.81 million on August 5 to 1.57 million on August 9, a decline of roughly 44% over four days.
The CLARITY Act’s delay removed one of XRP’s main narrative supports for the year, with the Senate entering recess without a vote and the first procedural vote now pushed to September 15.
Prediction markets responded immediately, with Polymarket pricing a 65% to 68% probability that XRP will trade at or below $1 at some point in August.
Macro conditions added a final layer of pressure, with July’s CPI report landing the same week and desks broadly reducing risk into the print.
The Case Against a Clean Bearish Read
Whale wallets added roughly 380 million XRP over the past week, lifting large-holder balances to approximately 8.1 billion tokens, suggesting accumulation rather than distribution during the decline.
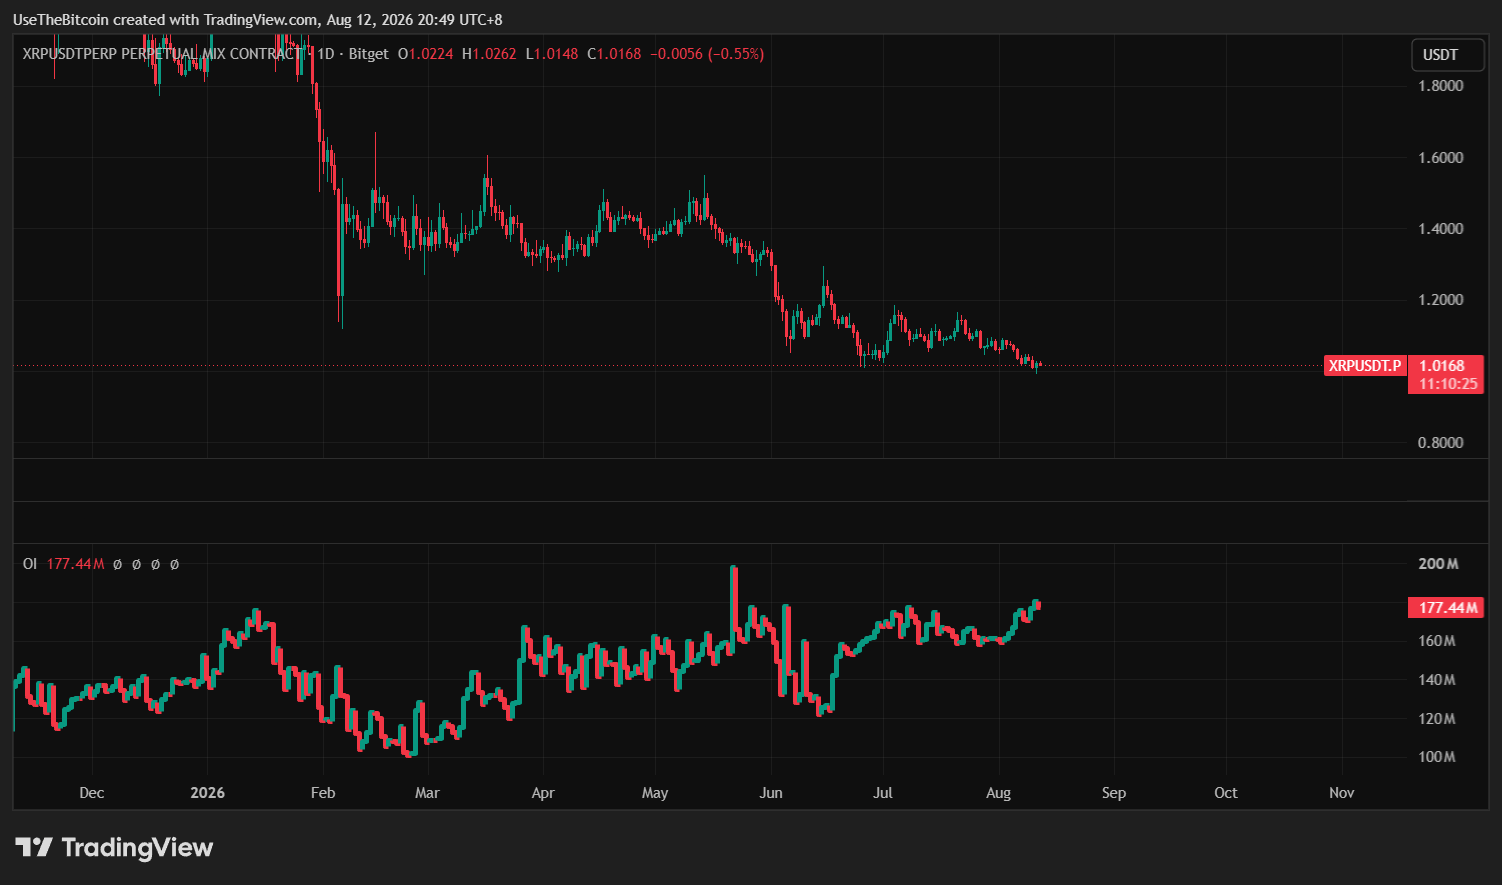
Separately, perpetual futures open interest climbed to 2.74 billion XRP even as price fell, a combination that typically points to fresh short positioning rather than long-side capitulation.
On the charts, the break below $1 came on a wick rather than a confirmed close, with price recovering about 44% of its intraday range by the time the two-hour candle settled.
The 200 EMA sits at $1.05649, roughly 5.4% above the current price, and has capped every rally attempt since August 4.
A descending trendline from that same date sits near $1.025 and would need to break before the next resistance test at $1.036, the level that would begin repairing near-term structure.
On the downside, a clean weekly close below the $1.04 shelf that XRP had held since November 2024 would open the path toward $0.94 and potentially $0.75 in a deeper breakdown.
Our most recent XRP price analysis covers these same technical levels in greater detail, alongside broader whale and ETF trends.
Bottom Line XRP Outlook in October
XRP hitting $27 by October 2026 is not supported by the math, the available ETF funding, or the token’s own historical best-case pace, and CryptoBull’s shifting prior targets add a further reason for caution.
The $7 middle line on the same chart is the more defensible level worth taking seriously, but even that would likely require the CLARITY Act to pass and ETF inflows to rebound to something like their initial launch pace, a combination that looks more plausible heading into 2027 than within the next two and a half months.
What this means for you: the more immediate, actionable question is not whether XRP hits $27 or even $7 this year; it is whether XRP can reclaim $1.036 and hold above its 200 EMA in the coming weeks, or whether this break below $1 develops into a deeper weekly breakdown toward the $0.94 to $0.75 range. That near-term structure will likely tell you more about where XRP is headed than any single analyst’s chart-based target.
This article is for informational purposes only and does not constitute financial advice. Crypto price predictions are based on analyst estimates and are not guarantees of future performance. Do your own research before making any investment decisions.
Frequently Asked Questions
Need a refresher? Here are the questions traders are asking about XRP’s outlook through October 2026.
Is the $27 XRP price target realistic by October 2026?
No. Reaching $27 would require about 31% weekly gains for twelve straight weeks, well beyond XRP’s strongest historical three-month pace of roughly 17% a week, and would need close to $1.6 trillion in fresh capital against roughly $1 million in actual ETF inflows so far in August.
What is a more realistic XRP price target based on the same chart?
The $7 middle line on CryptoBull’s own channel is more consistent with XRP’s historical best-case pace than the $27 upper line. Even that target would likely require the CLARITY Act to pass and a meaningful rebound in ETF inflows, conditions that look more plausible in 2027 than in the next few months.
Why did XRP fall below $1?
A combination of five factors converged, evaporating ETF demand, a wave of long liquidations, a 44% drop in XRP Ledger transaction activity, the CLARITY Act’s delayed Senate vote removing a key catalyst, and broader macro risk-off positioning of the July CPI report.
Are whales buying or selling XRP right now?
Buying, based on the most recent data. Whale wallets added roughly 380 million XRP over the past week even as price fell, and rising perpetual futures open interest during that decline suggests fresh short positioning rather than existing long holders capitulating.
What level would confirm XRP is recovering rather than breaking down further?
A reclaim of $1.036 would begin repairing near-term structure, but the more significant level is the 200 EMA at $1.05649, which has capped every rally attempt since early August. Clearing that level would be the clearest signal of a genuine trend change rather than a temporary bounce.