
Key Takeaways
- Ethereum dropped below $2,600 on October 7 as geopolitical tensions, ETF outflows, and broader crypto selling pushed ETH toward $2,500.
- US spot Ethereum ETFs recorded six consecutive trading days of outflows, while BitMine Chairman Tom Lee outlined plans to end ETH accumulation at 5% of supply.
- ETH must defend $2,500-$2,560 to avoid a deeper correction, while reclaiming $2,680-$2,800 could reopen the path toward $3,000.
Ethereum fell below $2,600 on October 7, extending its recent decline as selling pressure spread across the crypto market. The second-largest cryptocurrency by market cap traded around $2,565 during the sell-off, down approximately 5% over 24 hours after retreating from an intraday high near $2,700.
The decline followed escalating geopolitical tensions around the Strait of Hormuz, rising oil prices, and growing concerns about higher US Treasury yields. These developments weakened demand for risk assets, including Bitcoin and Ethereum.
Additionally, ETH also faced pressure from institutional investment flows, with US spot ETH exchange-traded funds (ETFs) recording their sixth consecutive trading day of net outflows, while BitMine Immersion Technologies Chairman Tom Lee revealed that the company plans to stop accumulating ETH once its holdings reach 5% of the circulating supply.
With Ethereum approaching the $2,500 support region, investors are watching whether buyers can defend the level or whether weakening momentum could trigger another decline toward $2,350.
Ethereum Falls Below $2,600 as Selling Pressure Intensifies
Ethereum’s latest decline followed its failure to maintain momentum above the $2,700 to $2,800 resistance region.
ETH traded near $2,712 on October 5 before weakening alongside the broader crypto market. By October 7, the price had fallen toward $2,565, placing the cryptocurrency close to an important technical support area.
The move marked a notable reversal from September’s recovery, when Ethereum tried to establish a stronger bullish trend.
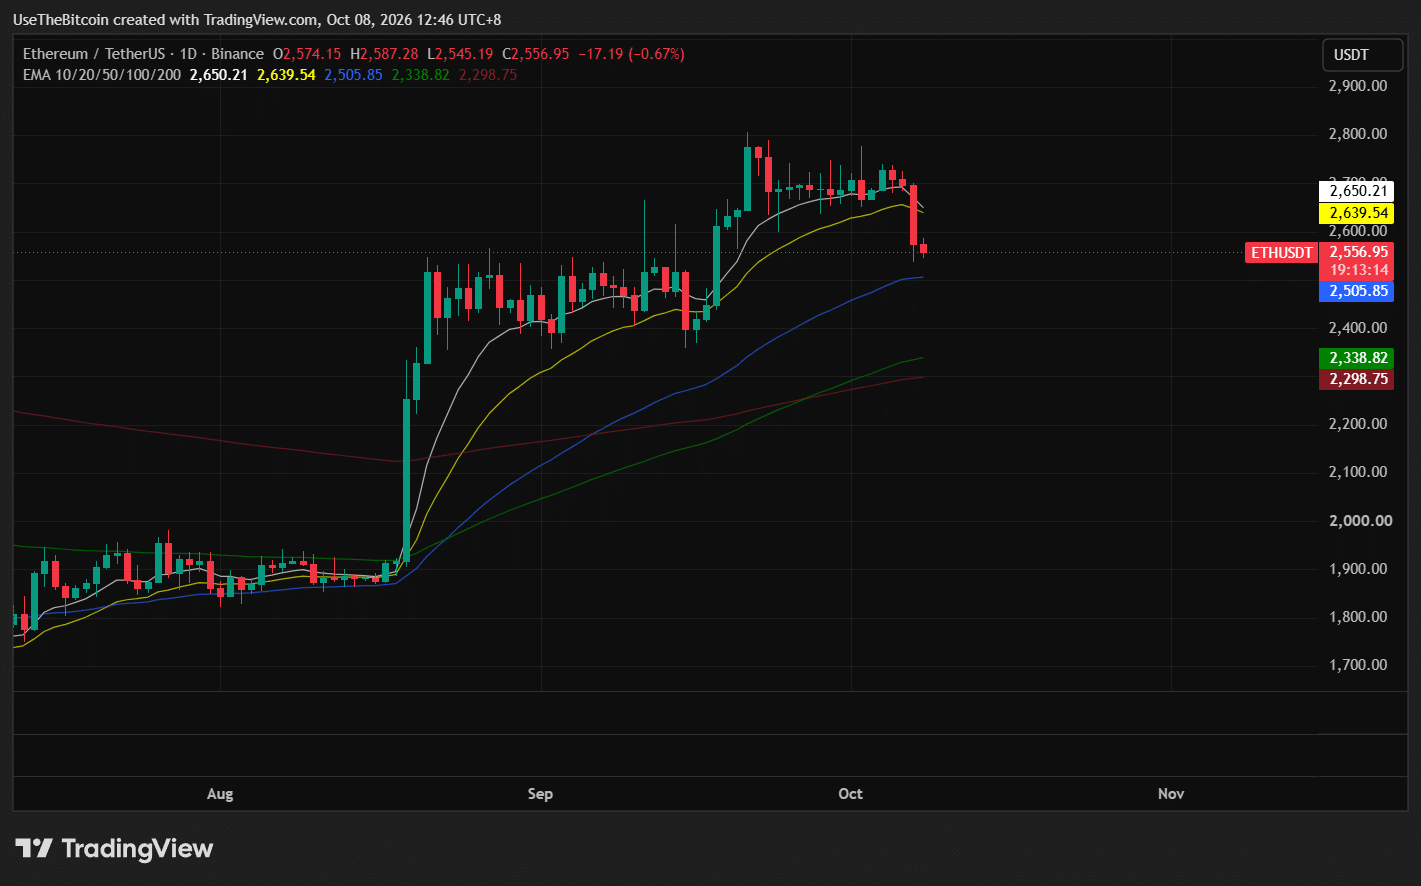
The $2,600 level has now become an important recovery target. Reclaiming it would suggest that buyers are beginning to absorb selling pressure, but a stronger recovery would require Ethereum to move above the $2,680 to $2,800 resistance region.
For now, Ethereum remains vulnerable while trading below these levels.
Ethereum Price Analysis: Key Support and Resistance Levels
Ethereum’s short-term technical outlook has weakened after the decline below $2,600. The immediate support region extends from approximately $2,500 to $2,560, where Ethereum is testing an area that previously supported its recovery.
Ethereum’s first support sits near $2,548 to $2,560, where the price is currently at this range. If buyers cannot defend this region, ETH could fall toward $2,500, near the 50-day EMA.
A sustained breakdown below $2,500 would weaken the recovery structure established during August and September, potentially exposing the $2,330 to $2,355 support area.
The broader $2,200 region would become relevant if selling pressure continued.
On the upside, Ethereum must first reclaim $2,600. A successful recovery would bring the $2,630 to $2,650 resistance zone into focus. This area includes a previously important horizontal price level and the 20-day EMA.
Above that, the $2,680 to $2,700 region represents another potential barrier.
A confirmed breakout through $2,780 to $2,800 would strengthen the short-term bullish outlook and create a possible path toward $3,000.
| Ethereum Level | Role |
| $2,600 | Immediate recovery resistance |
| $2,630-$2,650 | Short-term resistance and 20-day EMA region |
| $2,680-$2,700 | Secondary recovery resistance |
| $2,780-$2,800 | Major bullish confirmation zone |
| $3,000-$3,075 | Higher upside target |
| $2,548-$2,560 | Immediate support |
| $2,500-$2,503 | Critical support and 50-day EMA |
| $2,330-$2,355 | Next major downside support |
| $2,200-$2,204 | Broader daily support |
Table 1. Ethereum Key Support and Resistance Levels
The $2,500 level is particularly important because it represents both a psychological price level and part of Ethereum’s recent technical recovery structure.
Holding above this region could allow ETH to consolidate before another recovery attempt. However, a daily close below $2,500 would increase the risk of a deeper correction.
Geopolitical Tensions and Rising Oil Prices Pressure Ethereum
Ethereum’s decline occurred during a broader sell-off driven partly by geopolitical uncertainty. Reports of escalating attacks involving oil tankers around the Strait of Hormuz raised concerns about potential disruptions to global energy supplies.
The Strait of Hormuz is an important shipping route for oil exports. Any significant disruption could push energy prices higher and increase inflation concerns.
During the October 7 sell-off, Brent crude approached $102 per barrel, while the US 10-year Treasury yield rose toward 5.36%.
Higher oil prices can make inflation harder to control. If inflation remains elevated, central banks may have less room to lower interest rates.
Higher Treasury yields can also reduce demand for cryptocurrencies because investors have access to government bonds offering relatively attractive returns.
These conditions help explain why Ethereum weakened alongside Bitcoin and other major cryptocurrencies rather than experiencing an isolated decline.
However, geopolitical uncertainty was not the only factor affecting ETH. Continued ETF withdrawals and leveraged trading activity added market pressure.
Ethereum ETFs Record Six Consecutive Days of Outflows
US spot Ethereum ETFs recorded six consecutive trading days of net outflows through October 6, showing that investors continued withdrawing capital from ETH-linked investment products.
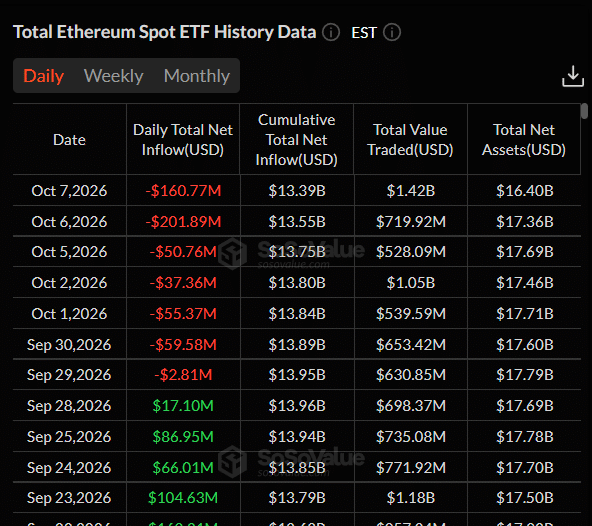
According to SoSoValue data, these funds experienced approximately $201.89 million in net withdrawals on October 6 and an additional $160.77 million outflow on October 7.
The withdrawals occurred while Bitcoin ETFs were attracting investment, highlighting the difference in institutional demand between the two cryptocurrencies.
The next important signal will be whether Ethereum ETFs return to positive daily flows.
A recovery in ETF demand could support market confidence and improve Ethereum’s chances of reclaiming $2,600.
Continued withdrawals, especially alongside weak spot trading activity, could make defending $2,500 harder.
BitMine Plans to Stop Buying Ethereum After Reaching 5% of Supply
Another important development involves BitMine Immersion Technologies, one of the largest corporate holders of Ethereum.
Speaking at the TOKEN2049 conference in Singapore, BitMine Chairman Tom Lee said the company intends to stop accumulating ETH after reaching its goal of owning 5% of Ethereum’s circulating supply.
The company has steadily purchased Ethereum since shifting to a crypto treasury strategy in June 2025.
According to its latest holdings disclosure, BitMine held approximately 6.016 million ETH as of October 4, representing roughly 4.9% of the circulating supply.
The company purchased another 15,112 ETH during its latest reported weekly buying period.
Lee said BitMine needs about 100,000 more ETH to reach its accumulation goal.
At its recent pace, the company could reach that target within the coming months, though timing depends on future purchases.
BitMine has been a consistent corporate buyer, helping absorb available supply even during periods of market weakness.
Once the company reaches its target, that source of recurring buying pressure could decline significantly.
However, ending new purchases does not mean BitMine plans to sell its existing Ethereum holdings.
The company has also staked approximately 5.067 million ETH through its Made in America Validator Network and other staking partners.
The main concern is therefore the potential reduction in future buying demand rather than an announced liquidation of BitMine’s holdings.
Ethereum Long Liquidations Surge as Traders Face Heavy Losses
Ethereum’s decline below $2,600 also triggered substantial liquidations in the derivatives market.
According to CoinGlass data, approximately $252 million in Ethereum futures positions were liquidated over 24 hours during the October 7 sell-off.
Of that amount, roughly $238.1 million involved long positions, while $13.8 million came from short positions.
This suggests that traders betting on higher Ethereum prices accounted for most forced closures.
The latest liquidation wave also represented one of Ethereum’s more significant periods of leveraged long losses since June, raising questions about whether the market has fully absorbed the selling.
Can Ethereum Hold $2,500 and Recover Toward $3,000?
Ethereum’s immediate outlook depends on whether buyers can defend the $2,500 to $2,560 support region.
The recent decline has weakened ETH’s momentum, but this area overlaps with an important technical level from its previous recovery.
A successful defense could allow Ethereum to stabilize and attempt another move above $2,600.
However, a sustained breakdown below $2,500 would increase the probability of a deeper correction.
For Ethereum to recover, buyers must first reclaim $2,600. A move above $2,630 to $2,650 would signal easing selling pressure.
The next challenge would be the $2,680 to $2,700 resistance region. If Ethereum successfully breaks above $2,780 to $2,800, the technical outlook would improve considerably.
This would create a potential path toward $3,000, followed by resistance near $3,075. However, a sustainable recovery would be more convincing with improving ETF flows and stronger spot demand.
In the bearish scenario, it begins if Ethereum fails to defend the $2,500 level; the next downside target would be approximately $2,355, followed by the 100-day EMA near $2,339.
If selling pressure continues, Ethereum could eventually revisit the $2,200 support region.
A deeper correction would become more likely if ETF withdrawals persist, geopolitical uncertainty increases, and leveraged traders continue facing liquidations.
| Scenario | What Would Support It | Levels to Watch |
| Bullish Case | ETH defends $2,500-$2,560, reclaims $2,680 and breaks above $2,800 | $3,000-$3,075 |
| Base Case | ETH holds $2,500 but struggles to sustain a recovery above $2,680 | $2,500-$2,680 consolidation |
| Bearish Case | ETH breaks below $2,500 amid continued ETF outflows and selling pressure | $2,330-$2,355, then $2,200 |
Table 2. Ethereum Bullish, Base and Bearish Scenarios
The base case assumes Ethereum remains within its recent trading range while investors assess whether institutional demand and broader market conditions are improving.
A bullish recovery requires stronger buying pressure and a confirmed move through resistance.
Meanwhile, the bearish scenario would gain support if Ethereum closes below $2,500 and fails to reclaim that level during subsequent trading sessions.
Final Thoughts
Ethereum’s short-term outlook has weakened after its decline below $2,600, with the $2,500 to $2,560 support region now determining whether ETH can stabilize.
A recovery above $2,680 would improve momentum, but a stronger bullish confirmation requires Ethereum to reclaim $2,800. A drop to $2,500 could expose the $2,330 to $2,355 region.
The main risks remain continued ETF outflows, elevated leverage, and the possibility that BitMine will soon complete its ETH accumulation target.
This article is for informational purposes only and does not constitute financial advice. Cryptocurrency markets are volatile, and technical price targets are not guaranteed. Always conduct your own research before making investment decisions.
Frequently Asked Questions
Here are the most common questions about Ethereum’s latest decline, institutional investment flows, and important price levels.
Why Did Ethereum Fall Below $2,600?
Ethereum declined amid geopolitical tensions, rising oil prices, and broader cryptocurrency selling. Six consecutive trading days of spot Ethereum ETF outflows and significant leveraged long liquidations added pressure to the market.
What Is Ethereum’s Main Support Level Right Now?
Ethereum’s immediate support lies between $2,500 and $2,560. A sustained breakdown below $2,500 could expose the $2,330 to $2,355 region, followed by broader support near $2,200.
How Much Was Liquidated During Ethereum’s Latest Decline?
Approximately $252 million in Ethereum futures positions were liquidated over 24 hours during the October 7 sell-off. Long positions accounted for roughly $238.1 million, showing that traders betting on higher ETH prices suffered most of the forced closures.
Is BitMine Planning to Sell Its Ethereum Holdings?
No sale was announced. BitMine Chairman Tom Lee said the company intends to stop accumulating ETH once its holdings reach 5% of Ethereum’s circulating supply. The plan concerns future purchases, not liquidating existing holdings.
Can Ethereum Recover to $3,000 in October 2026?
Ethereum could recover toward $3,000 if buyers defend the $2,500 to $2,560 support region and push ETH above resistance at $2,680 and $2,800. Improving ETF flows and stronger market demand would support that possibility, but a recovery is not guaranteed.
Why Are Ethereum ETF Outflows Important?
Ethereum ETF outflows indicate that investors are withdrawing capital from ETH-linked investment products. Persistent withdrawals can weaken institutional demand and market sentiment, although they do not necessarily represent selling by every type of Ethereum investor.