
Ethereum is trading near $2,500 as buyers defend the latest recovery, but the second-largest cryptocurrency by market cap remains trapped below resistance around $2,544 to $2,600 ahead of the August US Consumer Price Index (CPI) inflation report.
The broader trend remains constructive, as Ethereum is still above its major daily moving averages, while recent exchange withdrawals point to mild spot buying. However, derivatives activity has not strengthened at the same pace as price, suggesting traders remain cautious about using leverage near current levels.
The immediate question is whether CPI can provide enough momentum for ETH to break the range that has held it between roughly $2,431 and $2,544.
Ethereum Holds Near $2,500 as Momentum Cools
Ethereum has spent the past several sessions consolidating around $2,500 after a strong recovery from its July and August lows.
ETH recently traded near $2,500 and remains inside a rising structure that began around $1,900 in mid-August. Price has tested the upper end of the broader $2,350 to $2,600 range more than once without a sustained breakout.
Immediate support is the 20-day EMA near $2,467, as price is trading at $2,476 at the time of this writing. On the upside, $2,544 remains the first major barrier, followed by $2,600 to $2,626.
| Level | Role |
| $2,403-$2,431 | Key support zone |
| ~$2,476 | Current price area |
| $2,544-$2,600 | Major resistance zone |
| $2,626 | Next breakout level |
| $2,786-$2,800 | Higher resistance |
| ~$3,000-$3,050 | Larger bullish target |
Table 1. Ethereum Key Support and Resistance Levels
A sustained move above $2,600 would provide stronger evidence that Ethereum is leaving its recent consolidation behind. A drop to $2,431 would instead put the $2,403 area back under pressure.
Derivatives Traders Remain Cautious
Ethereum’s derivatives market has not fully confirmed the strength of the recent price recovery.
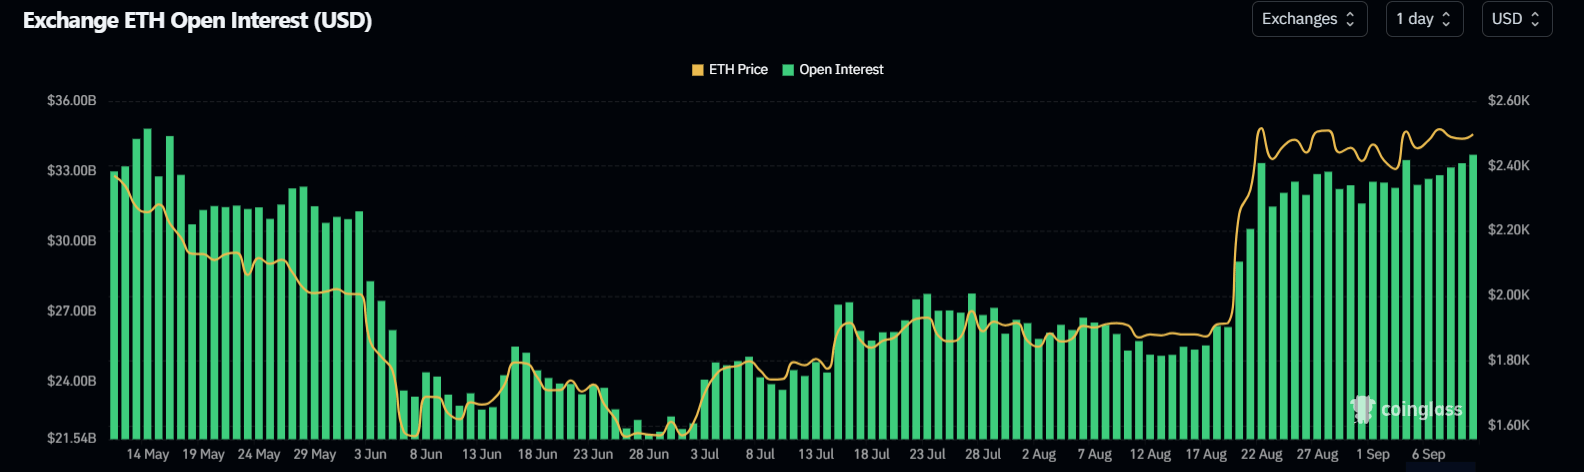
ETH futures open interest has fallen by roughly 1 million ETH since the recovery began in July. In dollar terms, open interest has risen about 54% to $33.7 billion since July 1, while ETH’s price increased around 58% over the same period.
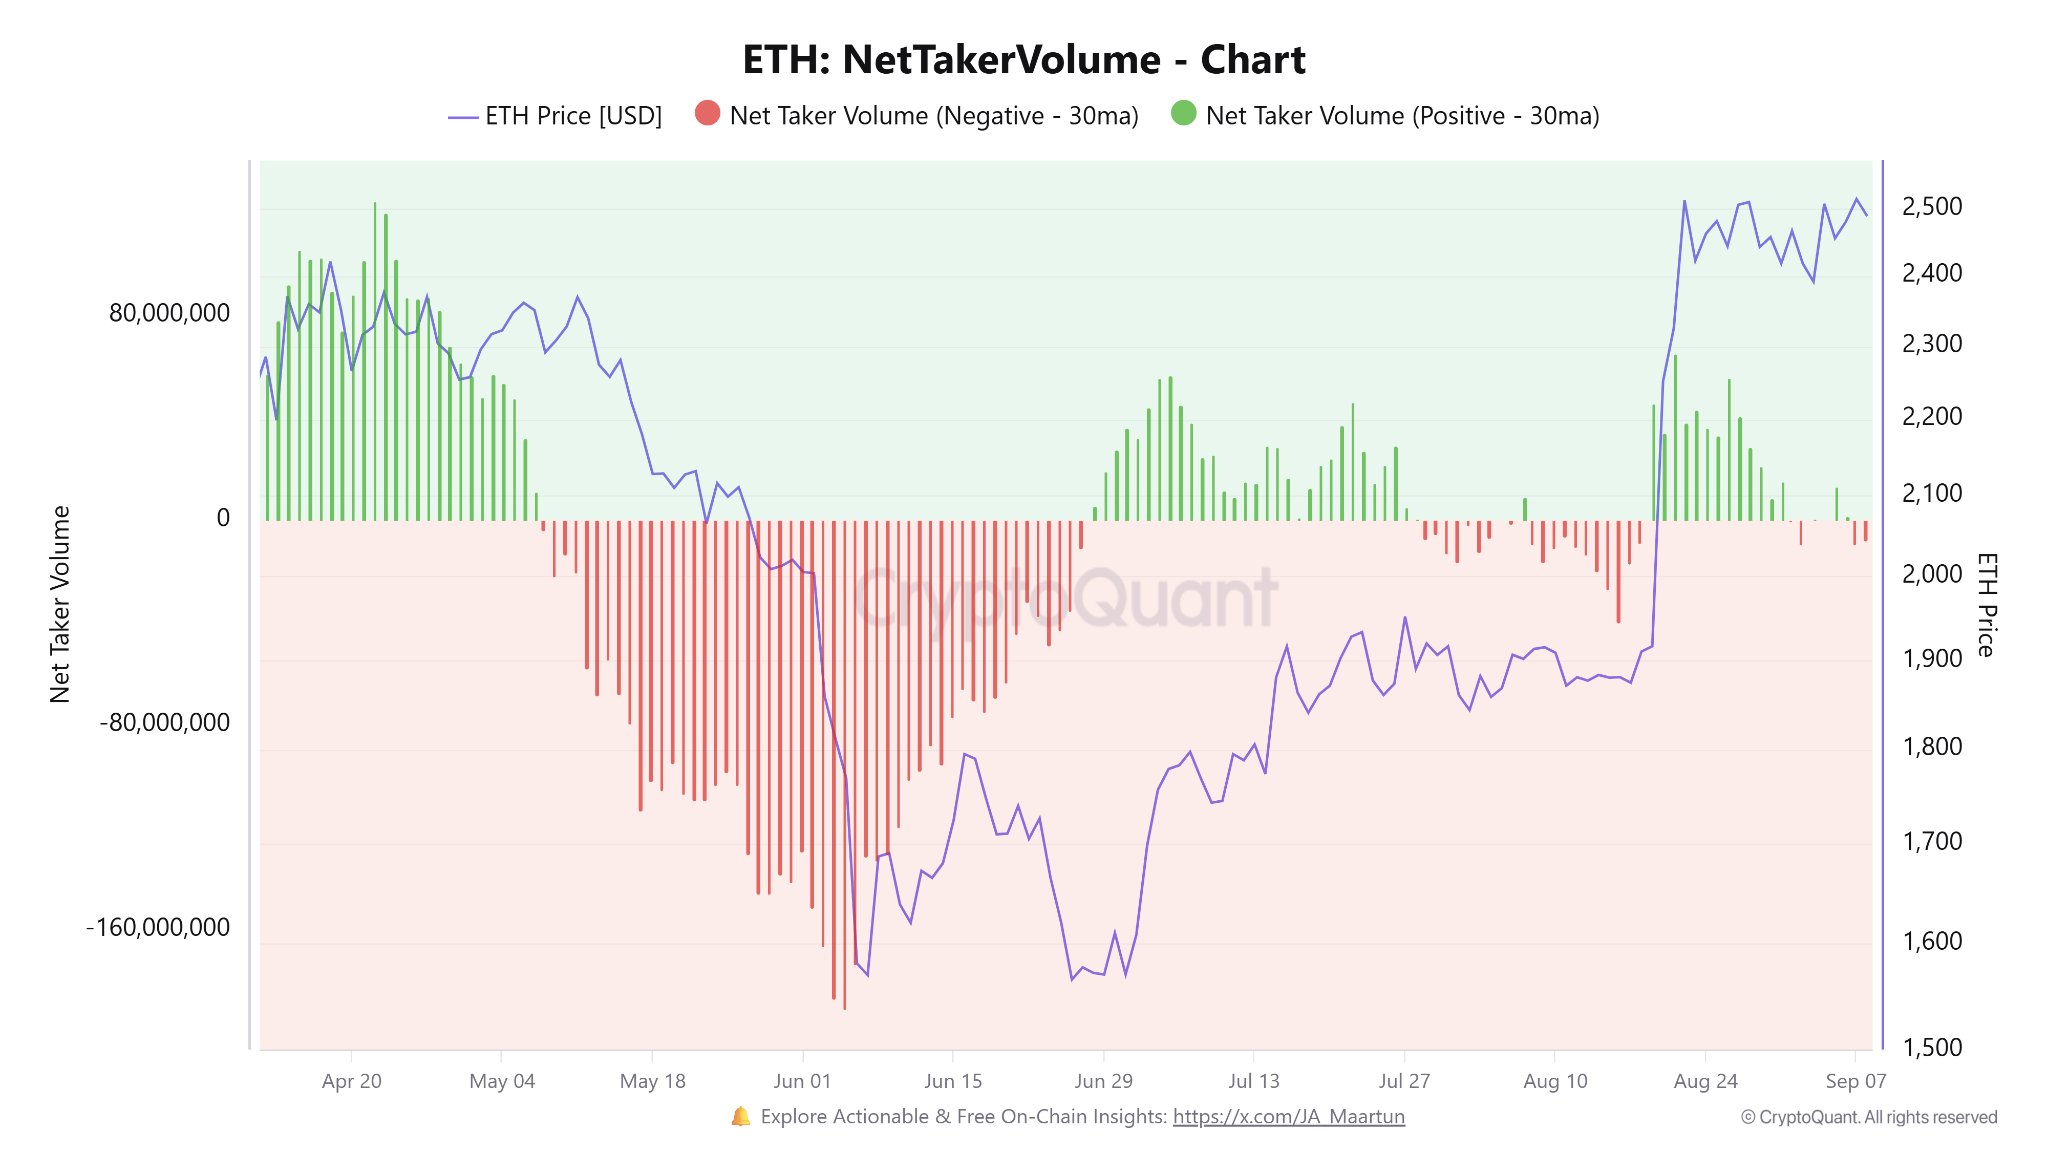
Net Taker Volume has also moved between positive and negative readings in recent sessions, showing that aggressive buyers and sellers have yet to establish clear control of the perpetual futures market.
The relatively calm leverage environment could reduce the risk of an immediate long-position flush, but it also shows that derivatives traders have not aggressively positioned for a breakout.
Spot Buying Provides Some Support
The spot market is showing a slightly stronger picture.
Ethereum withdrawals from exchanges have exceeded deposits over the past week, pointing to mild net buying pressure. Lower exchange balances can reduce the amount of ETH immediately available for sale, although transfers away from exchanges do not automatically mean investors plan to hold long term.
Spot Ethereum ETF flows have been more mixed, with a $24.3 million net outflow on Tuesday after stronger demand during August.
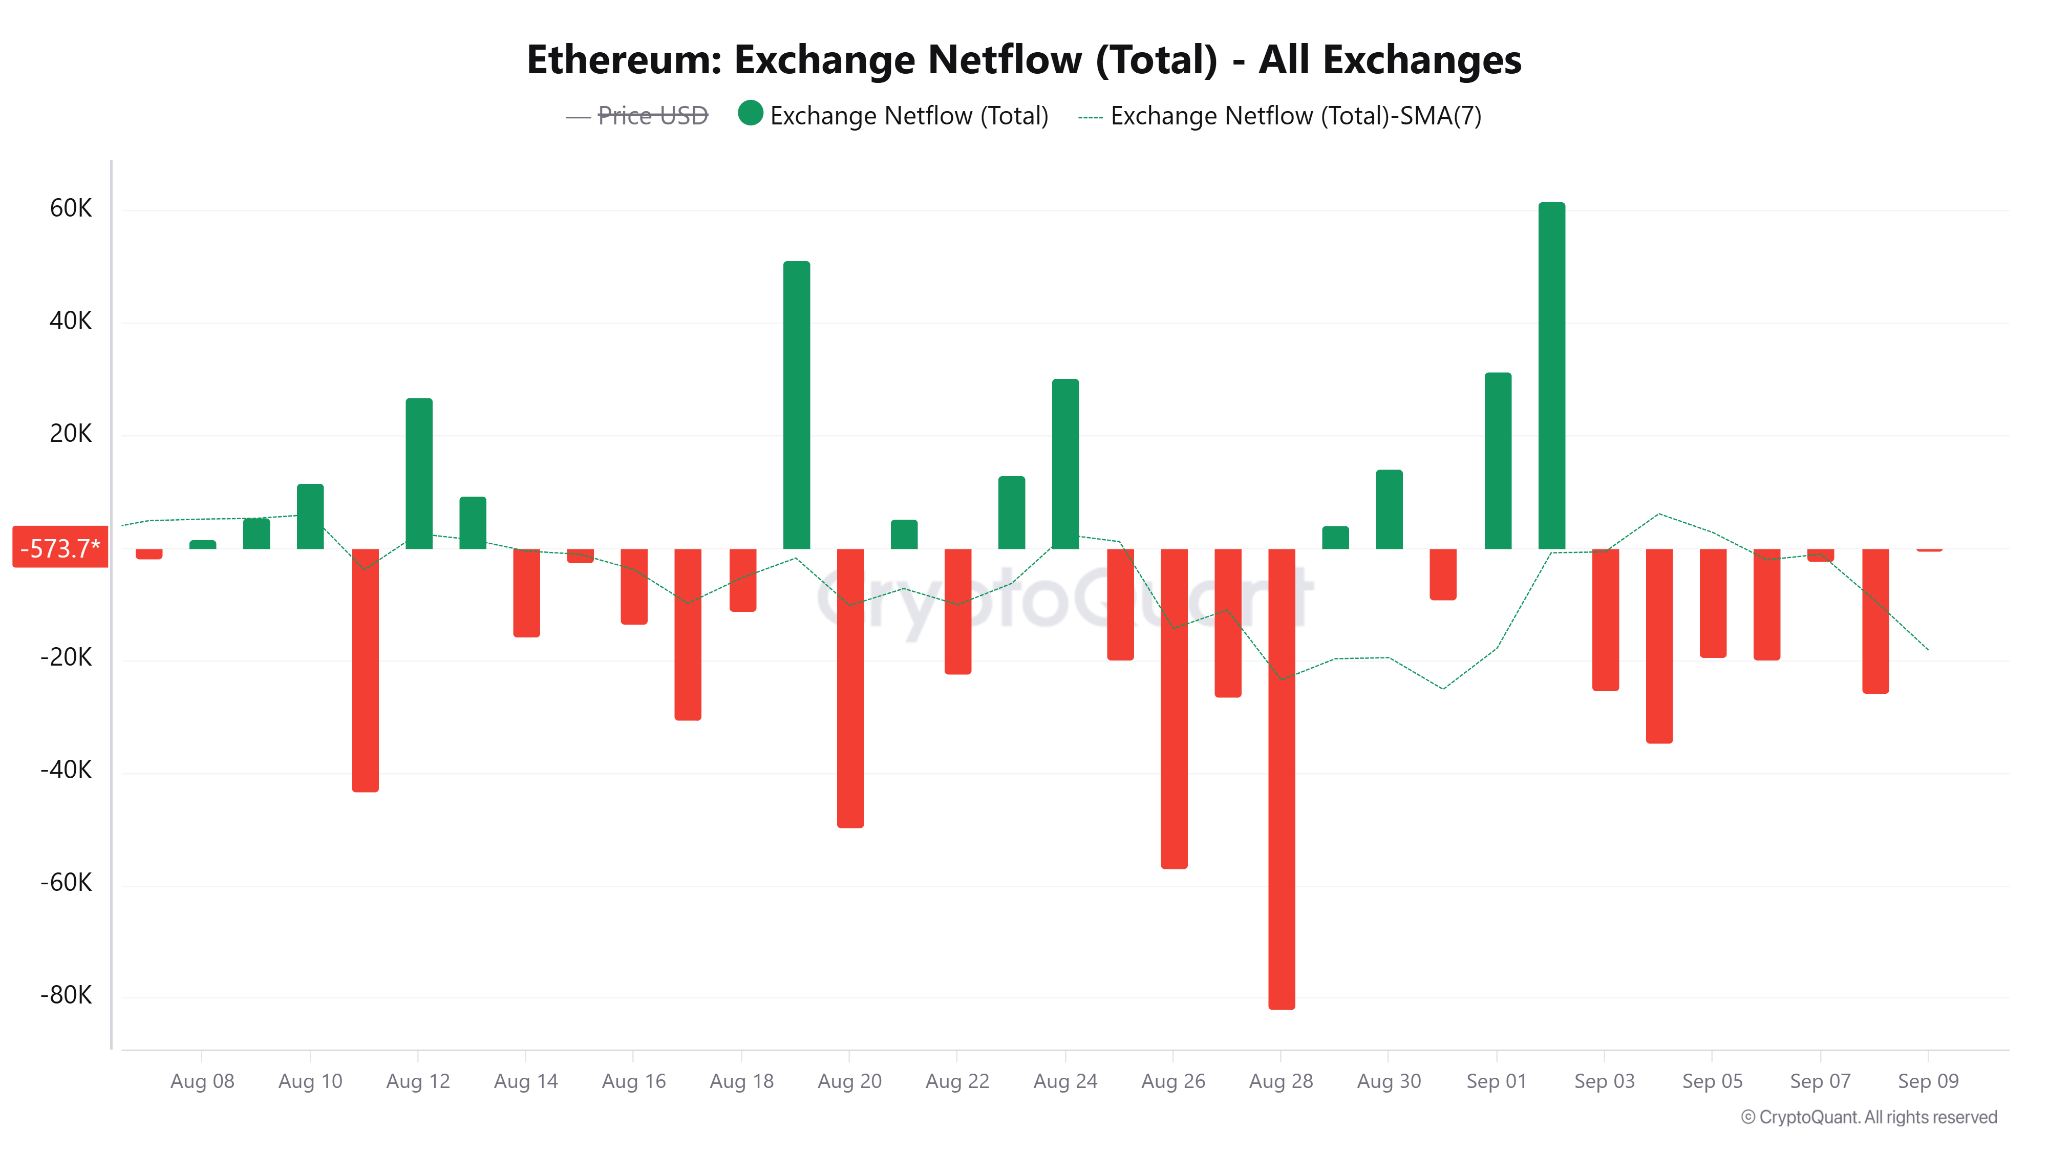
That leaves ETH with supportive spot-market conditions but without the strong ETF buying that helped fuel parts of the August rally.
$2,600 Is the Main Breakout Level
Ethereum’s technical structure remains bullish, with price staying above its major moving averages.
On the four-hour chart, ETH recently traded above the 20-period EMA near $2,483, the 50-period EMA around $2,473, the 100-period EMA near $2,424, and the 200-period EMA around $2,300.
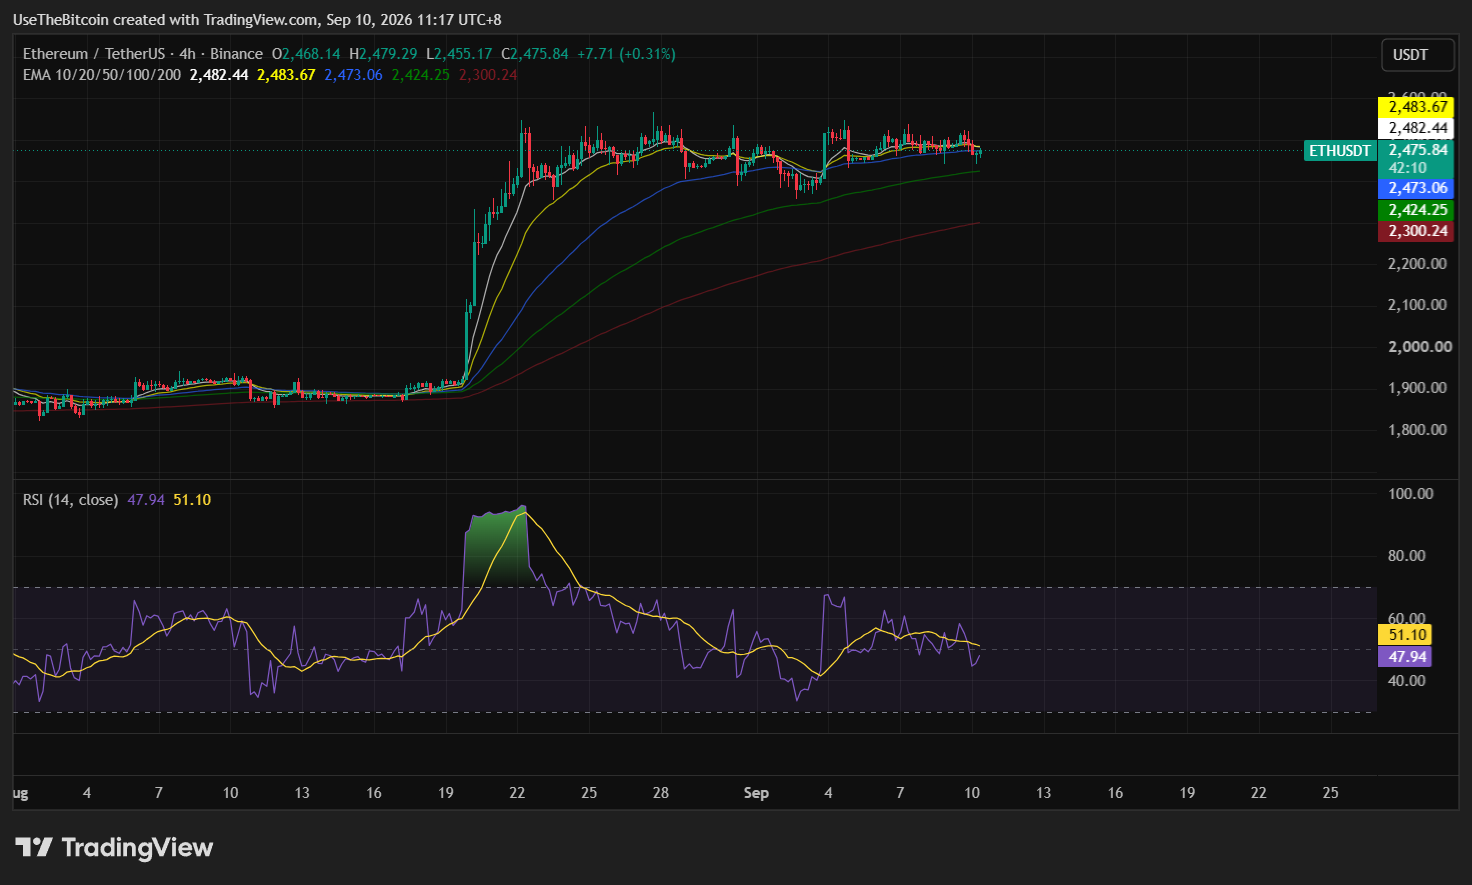
On the daily timeframe, ETH remains above its 20-, 50-, 100-, and 200-day EMAs, with the 20-day EMA providing the closest dynamic support. RSI remains in the 60s, indicating positive momentum without an extreme overbought reading.
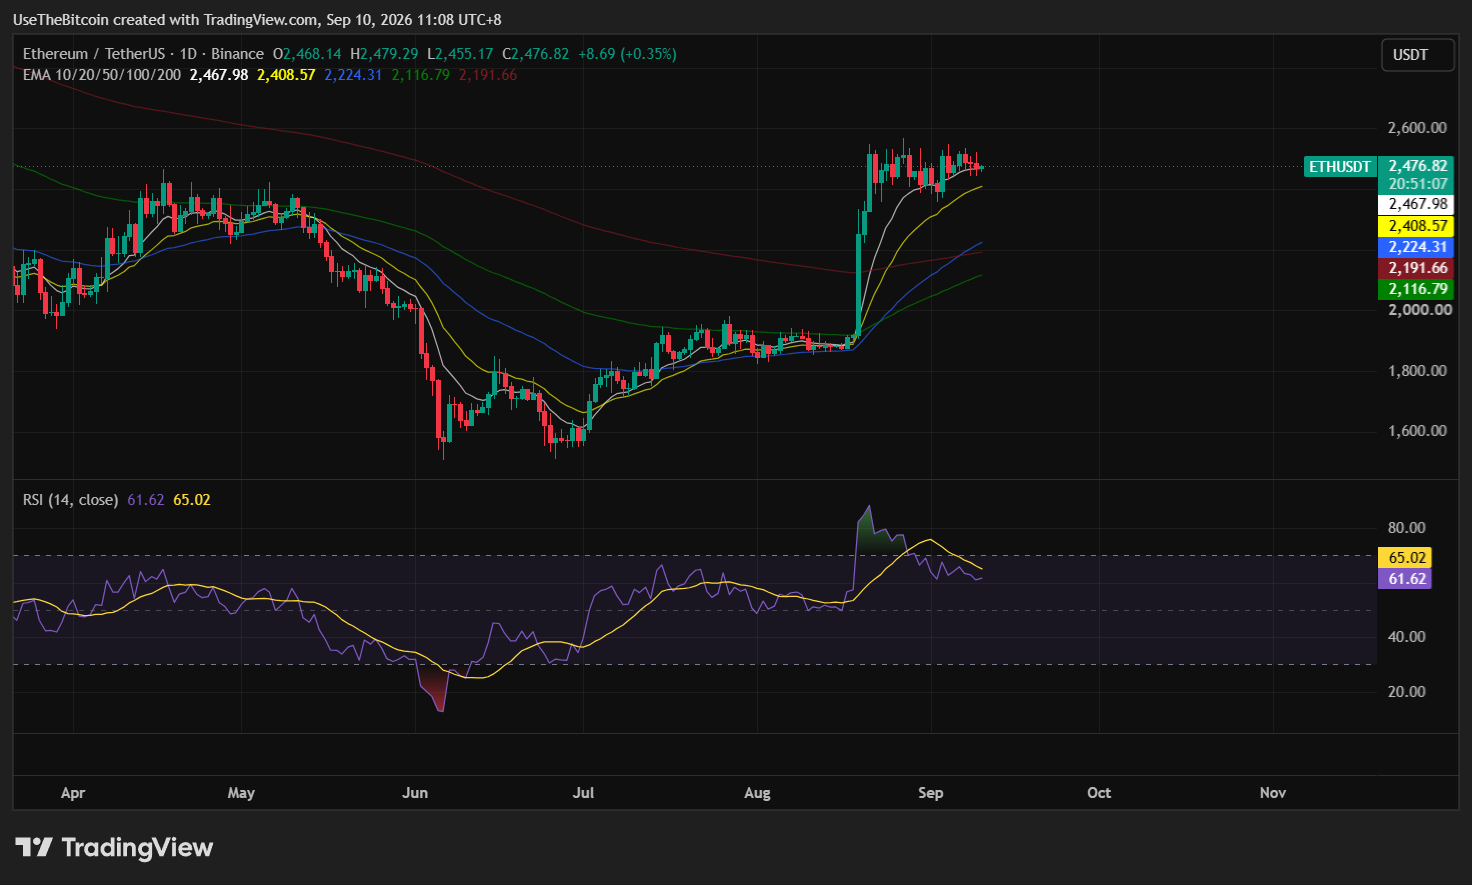
The challenge is overhead resistance. ETH has repeatedly struggled around $2,544 to $2,600. A weekly close above roughly $2,550 would strengthen the breakout case, with $2,800 emerging as an intermediate target before the larger $3,000 area.
CPI Could Decide Whether ETH Breaks $2,600
The August US CPI report is the most immediate macro catalyst for Ethereum.
ETH has remained resilient even as US government bond yields climbed, but inflation data could quickly change expectations for the September Federal Reserve meeting.
A softer CPI reading could ease pressure on Treasury yields and support risk assets, potentially helping Ethereum challenge $2,544 and $2,600.
A hotter reading could strengthen expectations for tighter monetary policy and make it harder for ETH to maintain the $2,500 area.
| CPI Scenario | Possible Market Reaction | Possible ETH Impact |
| Softer than expected | Rate pressure eases | ETH could challenge $2,544-$2,600 |
| Near expectations | Fed outlook changes little | ETH may remain range-bound |
| Hotter than expected | Yields and rate expectations rise | $2,431-$2,403 support could be tested |
Table 2. How CPI Could Affect Ethereum
However, CPI is not the final macro event. The Federal Reserve’s September decision follows next week, so traders could reassess any initial move as they update their FOMC expectations.
| Scenario | Price Trigger | Possible Outcome |
| Bullish Case | ETH holds $2,485 and breaks $2,600-$2,626 | $2,786-$2,800 comes into focus, with ~$3,000 possible if momentum continues |
| Base Case | ETH remains above $2,431 but below $2,600 | Consolidation continues around $2,500 |
| Bearish Case | ETH loses $2,431 and $2,403 | Recovery weakens, opening a move toward lower support around $2,290-$2,250 |
Table 3. Ethereum Price Scenarios for September 2026
The current structure favors consolidation until ETH decisively moves outside the $2,431 to $2,600 range, and the CPI report could catalyze that break.
Bottom Line
Ethereum remains near $2,500 with its broader uptrend intact, but buyers still need to clear the $2,544 to $2,600 resistance area.
Spot-market conditions are mildly supportive, while derivatives positioning remains cautious. Holding $2,431 to $2,403 would preserve the recovery, while a break above $2,600 could shift attention toward $2,800 and eventually the $3,000 area.
CPI is the immediate test. A softer inflation reading could help ETH challenge resistance, while hotter inflation could push price back toward support. The September FOMC decision will remain the next major macro catalyst after the CPI reaction.
This article is for informational purposes only and does not constitute financial advice. Crypto price predictions are based on analyst estimates and are not guarantees of future performance. Do your own research before making any investment decisions.
Frequently Asked Questions
Need a refresher? Here are some common questions about Ethereum’s current price setup.
What Is the Main Ethereum Resistance Level Right Now?
Ethereum faces immediate resistance around $2,544, followed by the broader $2,600 to $2,626 area. A sustained break above that zone would strengthen the case for a move toward $2,800.
Could Ethereum Reach $3,000?
A move toward $3,000 becomes more realistic if ETH first breaks out above $2,550 to $2,600 and then clears resistance around $2,800. Technical projections based on the current consolidation point to a larger upside target of $3,000 to $3,050, but that remains conditional, not guaranteed.
Why Does Ethereum Open Interest Matter?
Open interest shows how much capital is tied up in outstanding futures contracts. A rising price without equally strong growth in open interest can suggest leverage isn’t driving the rally as aggressively, which is currently the case with Ethereum.
How Could CPI Affect Ethereum?
CPI can change expectations for Federal Reserve interest-rate policy. Softer inflation could ease yield pressure and support ETH, while hotter inflation could strengthen expectations for tighter policy and weigh on crypto.
What Happens if Ethereum Falls Below $2,431?
A sustained break below $2,431 would weaken the short-term structure and put the 20-day EMA in focus. Below that, deeper support sits around the low-$2,200 area.