
Bitcoin is trading near $78,200 as buyers defend short-term support but struggle with resistance around $80,000 to $82,000.
The current setup balances improving onchain conditions with several near-term risks, as more than 71% of Bitcoin’s circulating supply is currently in profit, while US spot Bitcoin ETFs remain positive despite the latest outflow. At the same time, a larger share of profitable supply could create additional selling pressure when BTC returns to recent highs.
Macro conditions add another layer of uncertainty, with August CPI coming in on September 11, while rising oil prices, a stronger Japanese yen, and upcoming Federal Reserve and Bank of Japan (BOJ) decisions could increase volatility over the coming week.
Bitcoin Stalls Below the $80K to $82K Resistance Zone
Bitcoin has recovered strongly from the $60,000 area, reclaiming $67,000 and then the former $72,000 to $74,000 resistance zone.
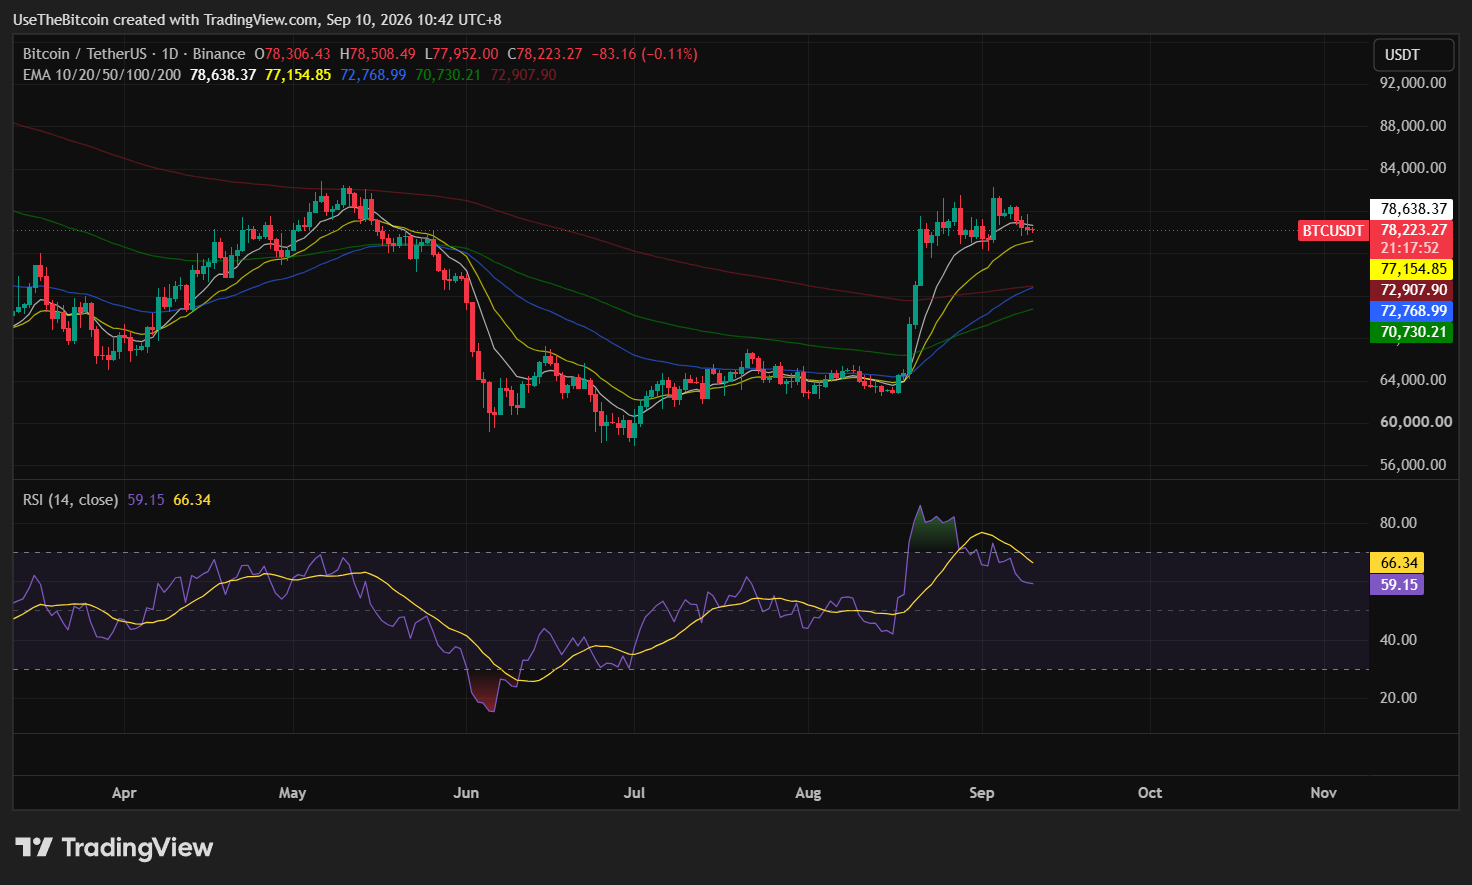
The recovery has slowed near $79,000, where BTC is consolidating just below a larger resistance area between $80,000 and $82,000. A sustained break above this zone would strengthen the recovery and give buyers a clearer path toward higher levels.
Shorter-term levels also remain important as buyers have recently shown interest around $77,600 to $77,900, while sell orders remain concentrated above $82,000. That leaves Bitcoin caught inside a relatively narrow range ahead of the Consumer Price Index (CPI) inflation report.
| Level | Role |
| $76,900-$77,300 | Lower short-term support |
| $77,600-$77,900 | Key support zone |
| $78,200 | Near-term support |
| ~$79,000 | Current pivot |
| $80,000-$82,000 | Major resistance zone |
| ~$82,700 | Next upside target if resistance breaks |
Table 1. Bitcoin Key Support and Resistance Levels
A move above $82,000 to $82,700 would give the recovery stronger confirmation. Losing the $77,000 area would instead increase the risk of another move toward lower support.
71% of Bitcoin Supply Is Now in Profit
Onchain data shows that more than 71% of Bitcoin’s circulating supply is currently sitting at an unrealized profit.
That figure is approaching the historical mean of 74.7%. Previous moves above that level have coincided with transitions toward stronger market conditions, although supply in profit should not be treated as a standalone bullish signal.
The composition of profitable supply has also changed. During Bitcoin’s May consolidation above $82,500, about 67% of supply was in profit. At similar price levels now, the figure is above 71%.
| Period | BTC Price Area | Supply in Profit |
| May consolidation | Above $82,500 | ~67% |
| Current market | Near recent range | >71% |
| Historical mean | N/A | 74.7% |
Table 2. Bitcoin Supply in Profit Compared With May
The increase has two sides. More profitable supply can signal healthier market conditions, but it also means more holders are sitting on gains when Bitcoin approaches $82,000.
That creates a larger pool of potential profit-taking and could help explain why BTC has repeatedly struggled to clear the upper end of its range.
Bitcoin ETF Flows Remain Positive Despite Latest Outflow
US spot Bitcoin ETFs recorded a net outflow of about $46.6 million on September 8, reversing part of the strong inflows seen earlier in the month, according to SoSoValue and CoinGlass data.
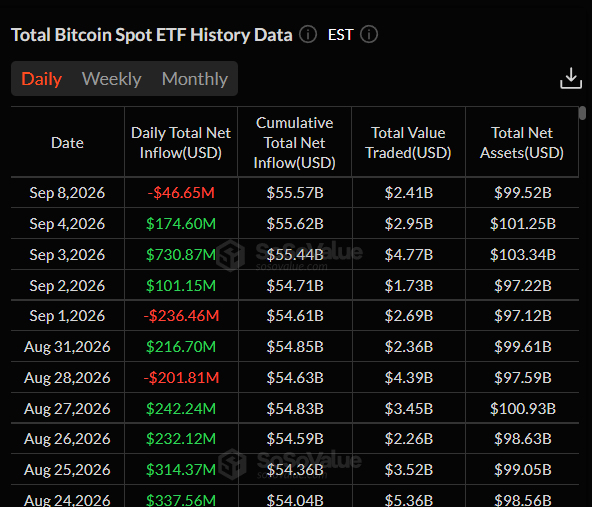
Despite the latest negative session, September net inflows remained around $723.5 million through the first five trading days.
Notably, the month has been volatile, with Bitcoin ETFs recording a $236.5 million outflow on September 1 before attracting $101.1 million on September 2, $730.9 million on September 3, and $174.6 million on September 4.
That means ETF demand remains supportive overall, but it has not been consistently positive from one session to the next. Continued inflows could help absorb profit-taking as Bitcoin approaches the $80,000 to $82,000 resistance zone, while a sustained return to outflows would remove one source of demand.
The next few sessions will be especially important because CPI and the September FOMC meeting could influence both Bitcoin price and institutional ETF flows.
This Week’s CPI Could Break Bitcoin Out of Its Range
The August CPI report is the most immediate macro catalyst.
Bitcoin has recently traded largely between $78,000 and $82,000, and inflation data could provide the trigger needed to push price outside that range.
The market expects headline inflation to remain around 3.4%. A hotter reading could strengthen expectations for tighter Federal Reserve policy, potentially lifting Treasury yields and pressuring Bitcoin.
On the other hand, a softer CPI result could have the opposite effect by reducing rate-hike expectations and improving risk appetite ahead of the September 16 Federal Open Market Committee (FOMC) meeting.
| CPI Scenario | Possible Market Reaction | Possible BTC Impact |
| Softer than expected | Rate pressure eases | BTC could challenge $80K-$82K |
| Near expectations | Fed outlook changes little | Consolidation may continue |
| Hotter than expected | Yields and rate-hike expectations rise | BTC could retest $77K support |
Table 3. How CPI Could Affect Bitcoin Ahead of the FOMC. These are scenarios rather than forecasts. Bitcoin’s reaction will also depend on ETF flows, oil prices, the dollar, and broader risk sentiment.
Oil and Yen Carry Trade Risks Add Pressure
Bitcoin is also facing two macro risks beyond the US inflation report.
Oil prices have risen following renewed US-Iran tensions, with Brent crude moving above $100 and other benchmarks climbing as well.
Higher energy prices can feed inflation concerns and make it harder for central banks to ease monetary policy.
Meanwhile, the Japanese yen has strengthened ahead of the BOJ’s September 16 meeting. A stronger yen can put pressure on yen-funded carry trades, where investors borrow cheaply in Japan and deploy that capital into higher-return assets elsewhere.
Bitcoin has held up better than during the sharp carry trade unwind of 2024, but faster yen appreciation could still trigger deleveraging across risk markets.
| Scenario | Price Trigger | Possible Outcome |
| Bullish Case | BTC holds $77,600-$77,900 and breaks $82,000–$82,700 | Recovery strengthens and higher resistance comes into focus |
| Base Case | BTC remains between roughly $77,000 and $82,000 | Consolidation continues through CPI and central bank decisions |
| Bearish Case | BTC loses $77,000 and fails to recover quickly | Selling pressure increases and lower support becomes vulnerable |
Table 4. Bitcoin Price Scenarios for September 2026
The current structure still favors consolidation until Bitcoin decisively breaks one side of the range. CPI provides the first major opportunity for that to happen.
Bottom Line
Bitcoin remains near $79,000 with buyers defending support around $77,600 to $77,900 but struggling to break the $80,000 to $82,000 resistance zone.
Onchain conditions are improving, with more than 71% of circulating supply now in profit, while ETF inflows continue to provide demand.
CPI on September 11 is the next major test. A softer inflation reading could help BTC challenge $82,000, while hotter inflation could shift attention back toward $77,000. The September 16 Fed and BOJ decisions will remain important after the CPI reaction.
This article is for informational purposes only and does not constitute financial advice. Crypto price predictions are based on analyst estimates and are not guarantees of future performance. Do your own research before making any investment decisions.
Frequently Asked Questions
Need a refresher? Here are some common questions about Bitcoin’s current price setup.
Why Is Bitcoin Struggling to Break $82,000?
Bitcoin is encountering concentrated selling around $80,000 to $82,000. More than 71% of supply is also currently in profit, meaning a larger group of holders has unrealized gains they could take when BTC approaches recent highs.
What Is the Key Bitcoin Support Level Right Now?
The first important support area is around $77,600 to $77,900. Below that, the $76,900 to $77,300 region becomes more important.
How Could CPI Affect Bitcoin?
CPI can change expectations for Federal Reserve interest-rate policy. Softer inflation could reduce yield pressure and support risk assets, while hotter inflation could strengthen expectations for tighter policy and weigh on Bitcoin.
Why Does Bitcoin Supply in Profit Matter?
Supply in profit measures how much circulating Bitcoin is currently worth more than its estimated acquisition price. Rising profitable supply can reflect an improving market, but it can also increase potential profit-taking when BTC reaches resistance.
Could the Yen Carry Trade Affect Bitcoin Again?
Yes. A sharp rise in the yen can make yen-funded borrowing less attractive and encourage investors to unwind leveraged positions. Bitcoin weathered the latest yen strength relatively well, but a disorderly carry trade unwind could still create volatility.