
Ethereum is trading near $2,440 after the Federal Reserve raised interest rates by 25 basis points, yet ETH continues to hold inside the same consolidation range that has controlled price since late August.
The Federal Open Market Committee (FOMC) raised the federal funds target range to 3.75% to 4.00% on September 16. The Fed said economic activity remains solid while inflation is still elevated, reinforcing its commitment to returning inflation to the 2% target.
Like Bitcoin, Ethereum remains highly sensitive to the Fed’s policy path. However, ETH’s current chart structure looks comparatively resilient.
Bitcoin is testing more immediate support near $75,000, while Ethereum continues to move sideways above its broader breakout zone despite repeated failures around $2,500.
The next test is that ETH needs to hold the $2,350 to $2,400 area and eventually reclaim $2,500. A clean breakout could put $2,600 and then $3,000 back into focus, while a breakdown below the consolidation floor would expose $2,250 and potentially the $2,000 to $2,100 region.
Ethereum Remains in Consolidation After Another $2.5K Rejection
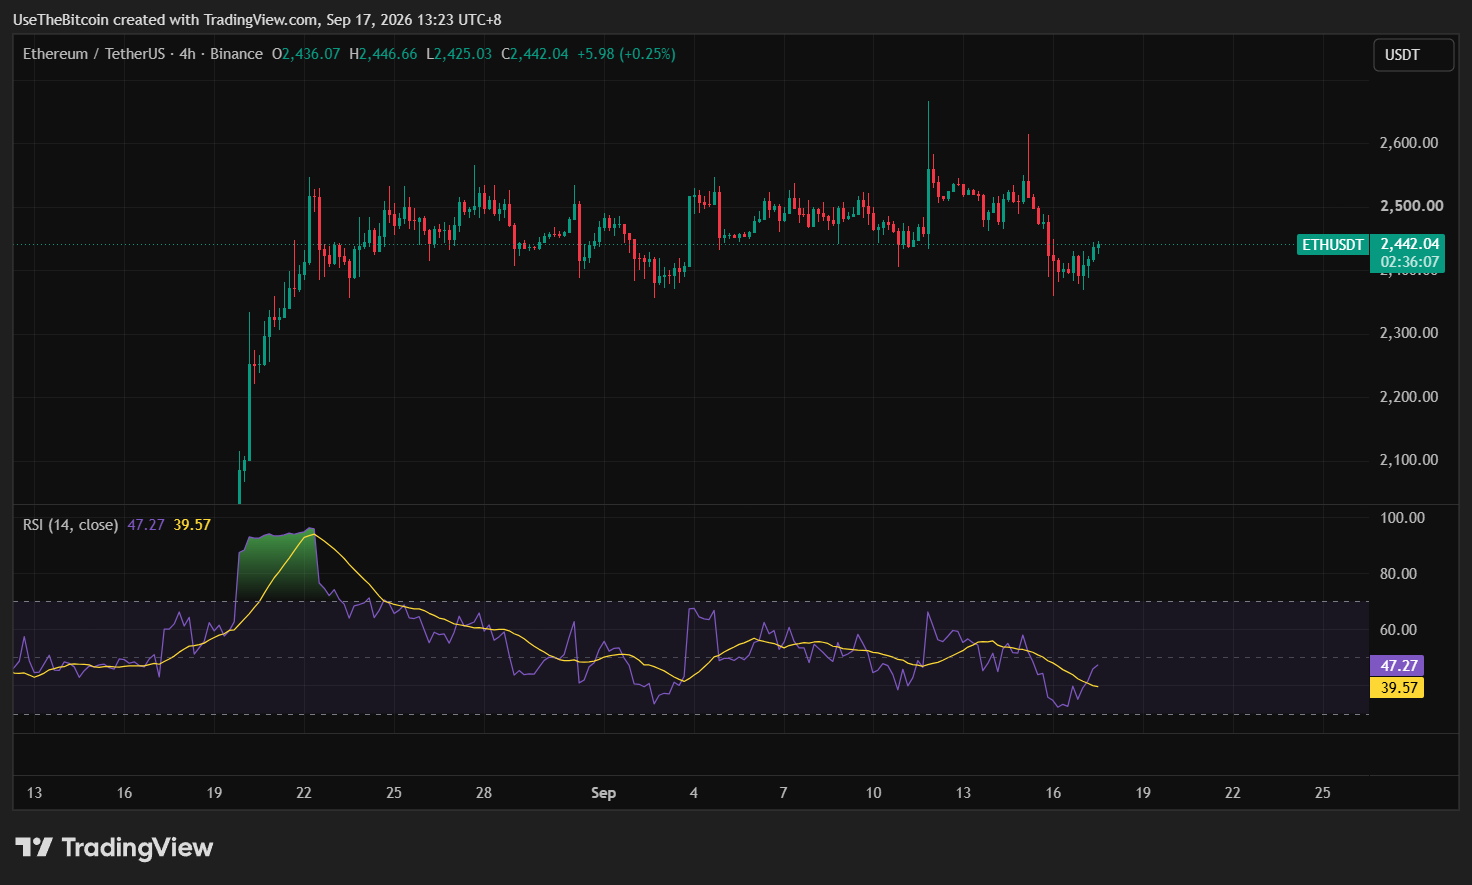
Ethereum has spent several weeks consolidating around the $2,400 to $2,500 area after a strong recovery from the summer lows.
The latest daily chart shows ETH trading near $2,443, still above the major breakout zone from August. The current structure remains stronger than it was earlier in the summer, when Ethereum traded below $2,000.
ETH’s broader four-hour consolidation is between approximately $2,350 and $2,600, with $2,500 continuing to act as the main resistance area.
| Level | Role |
| $2,000-$2,100 | Major medium-term support |
| ~$2,250 | Secondary downside support |
| $2,350-$2,400 | Consolidation floor |
| ~$2,443 | Current price area |
| ~$2,500 | Main resistance |
| ~$2,600 | Upper range resistance |
| ~$3,000 | Larger upside target |
Table 1. Ethereum Key Support and Resistance Levels
The range remains intact as long as ETH holds above roughly $2,350. A daily close above $2,500 would be the clearest sign that consolidation is beginning to resolve higher.
ETH Structure Still Looks More Resilient Than Bitcoin
Ethereum and Bitcoin are reacting to the same macro environment, but their chart structures are currently different.
Bitcoin is defending the $75,000 area after the Fed’s rate hike and remains below its first recovery zone around $77,000 to $78,000.
Ethereum is still holding inside the same horizontal range that formed after its August breakout. ETH has repeatedly failed to sustain moves above $2,500, but those rejections have not yet produced a major breakdown.
A failed breakout followed by higher lows or continued sideways trading can still represent consolidation rather than outright trend reversal. ETH would need to lose the $2,350 area before the structure becomes materially weaker.
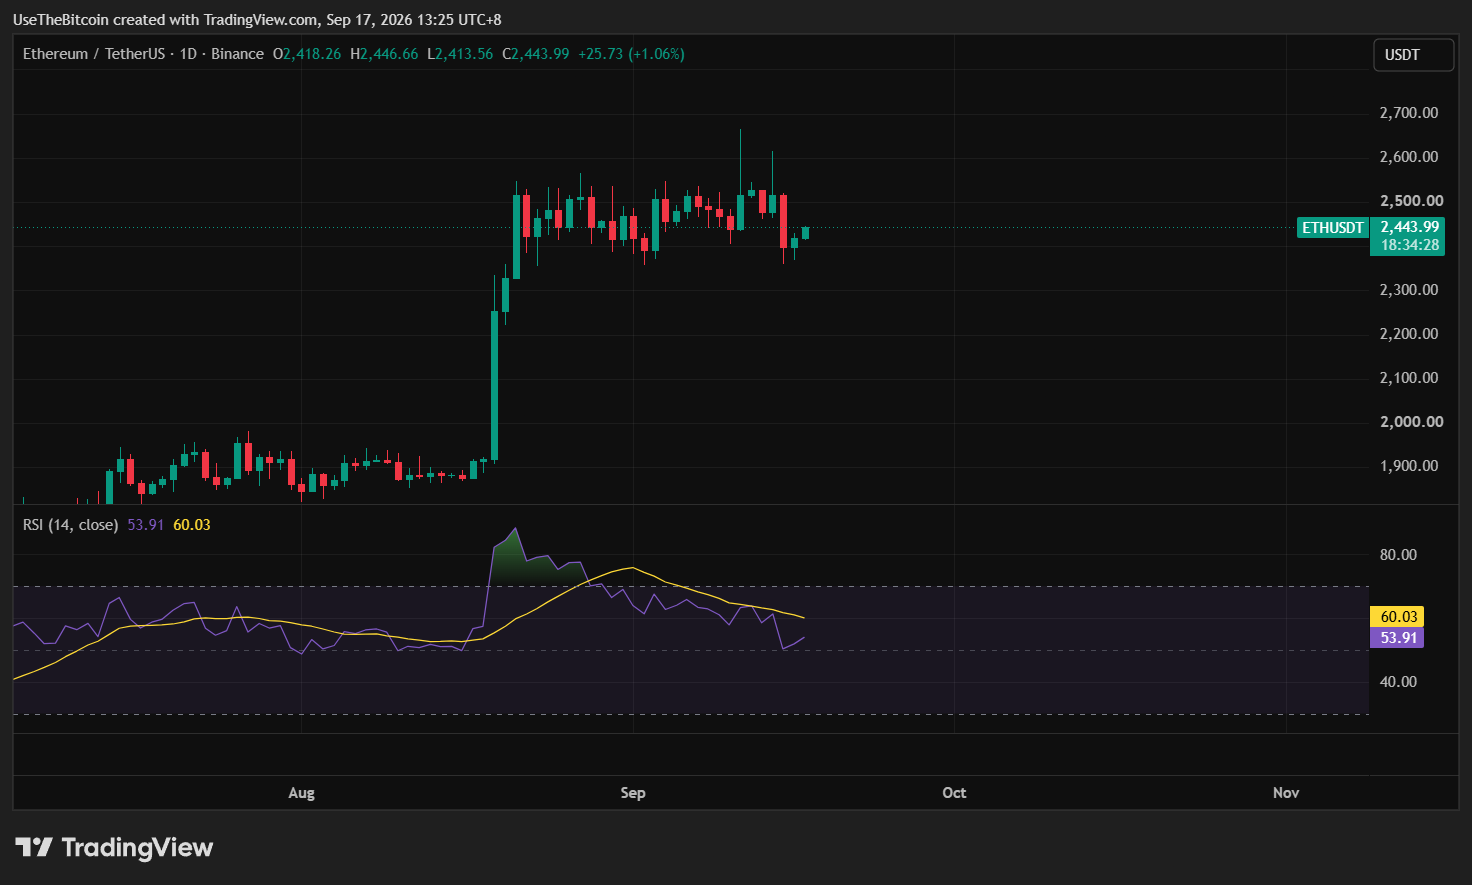
The daily relative strength index (RSI) is also near 54, keeping momentum broadly neutral rather than oversold or deeply bearish.
Ethereum has not confirmed a new bullish leg, but it has also avoided the kind of structural deterioration that would signal the August recovery has failed.
$2.5K Remains Ethereum’s Main Barrier
Ethereum’s repeated inability to hold above $2,500 remains the biggest technical problem. ETH has tested the area several times since its August rally but has yet to establish sustained acceptance above it. A decisive daily close above $2,500 could open the way toward $3,000, while continued rejection keeps Ethereum trapped inside the current range.
Ethereum briefly traded above the level earlier this month and reached into the $2,600 area, but sellers again pushed price back toward $2,400.
The next move above $2,500 needs to hold if buyers want to prove that the breakout is more than temporary.
The first confirmation would be a daily close above $2,500. Holding above $2,600 would provide stronger evidence that consolidation has ended.
Ethereum ETF Flows Are Mixed Rather Than Decisively Bearish
US spot Ethereum ETF flows weakened around the Fed meeting, but the broader seven-session picture is still much less negative than Bitcoin’s.
According to the SoSoValue data, Ethereum ETFs recorded $224.11 million in net outflows on September 16 after another $141.47 million left the funds on September 15, totaling $365.58 million exited across the two sessions surrounding the Fed decision.
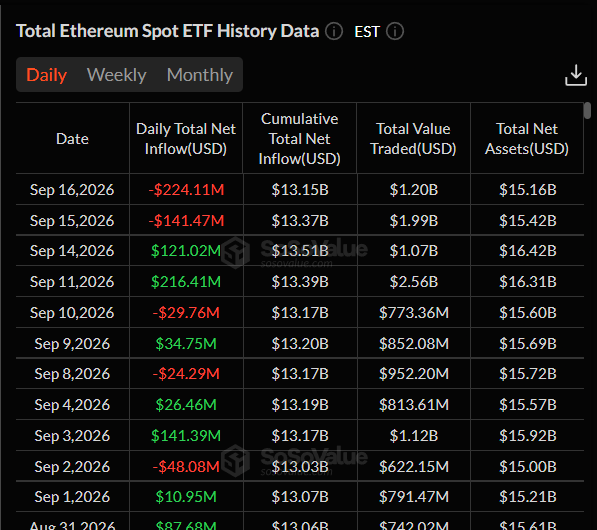
However, the seven reported sessions from September 8 through September 16 produced only about $47.45 million in net outflows overall because strong inflow days partially offset the recent withdrawals.
Bitcoin ETFs recorded roughly $1.05 billion in net outflows across the comparable seven-session stretch, while Ethereum’s net result was close to flat at approximately $47 million in outflows.
That suggests institutional selling pressure has been milder in Ethereum ETFs over the same period, although the sharp September 15 and 16 outflows still need monitoring for signs of a broader reversal in demand.
Exchange Supply Continues to Tighten
Ethereum’s onchain supply picture remains one of the more constructive parts of the current setup.
Exchange reserve data from CryptoQuant shows ETH held on exchanges falling from above 21 million ETH in the first half of 2025 to roughly 14.6 million ETH now.
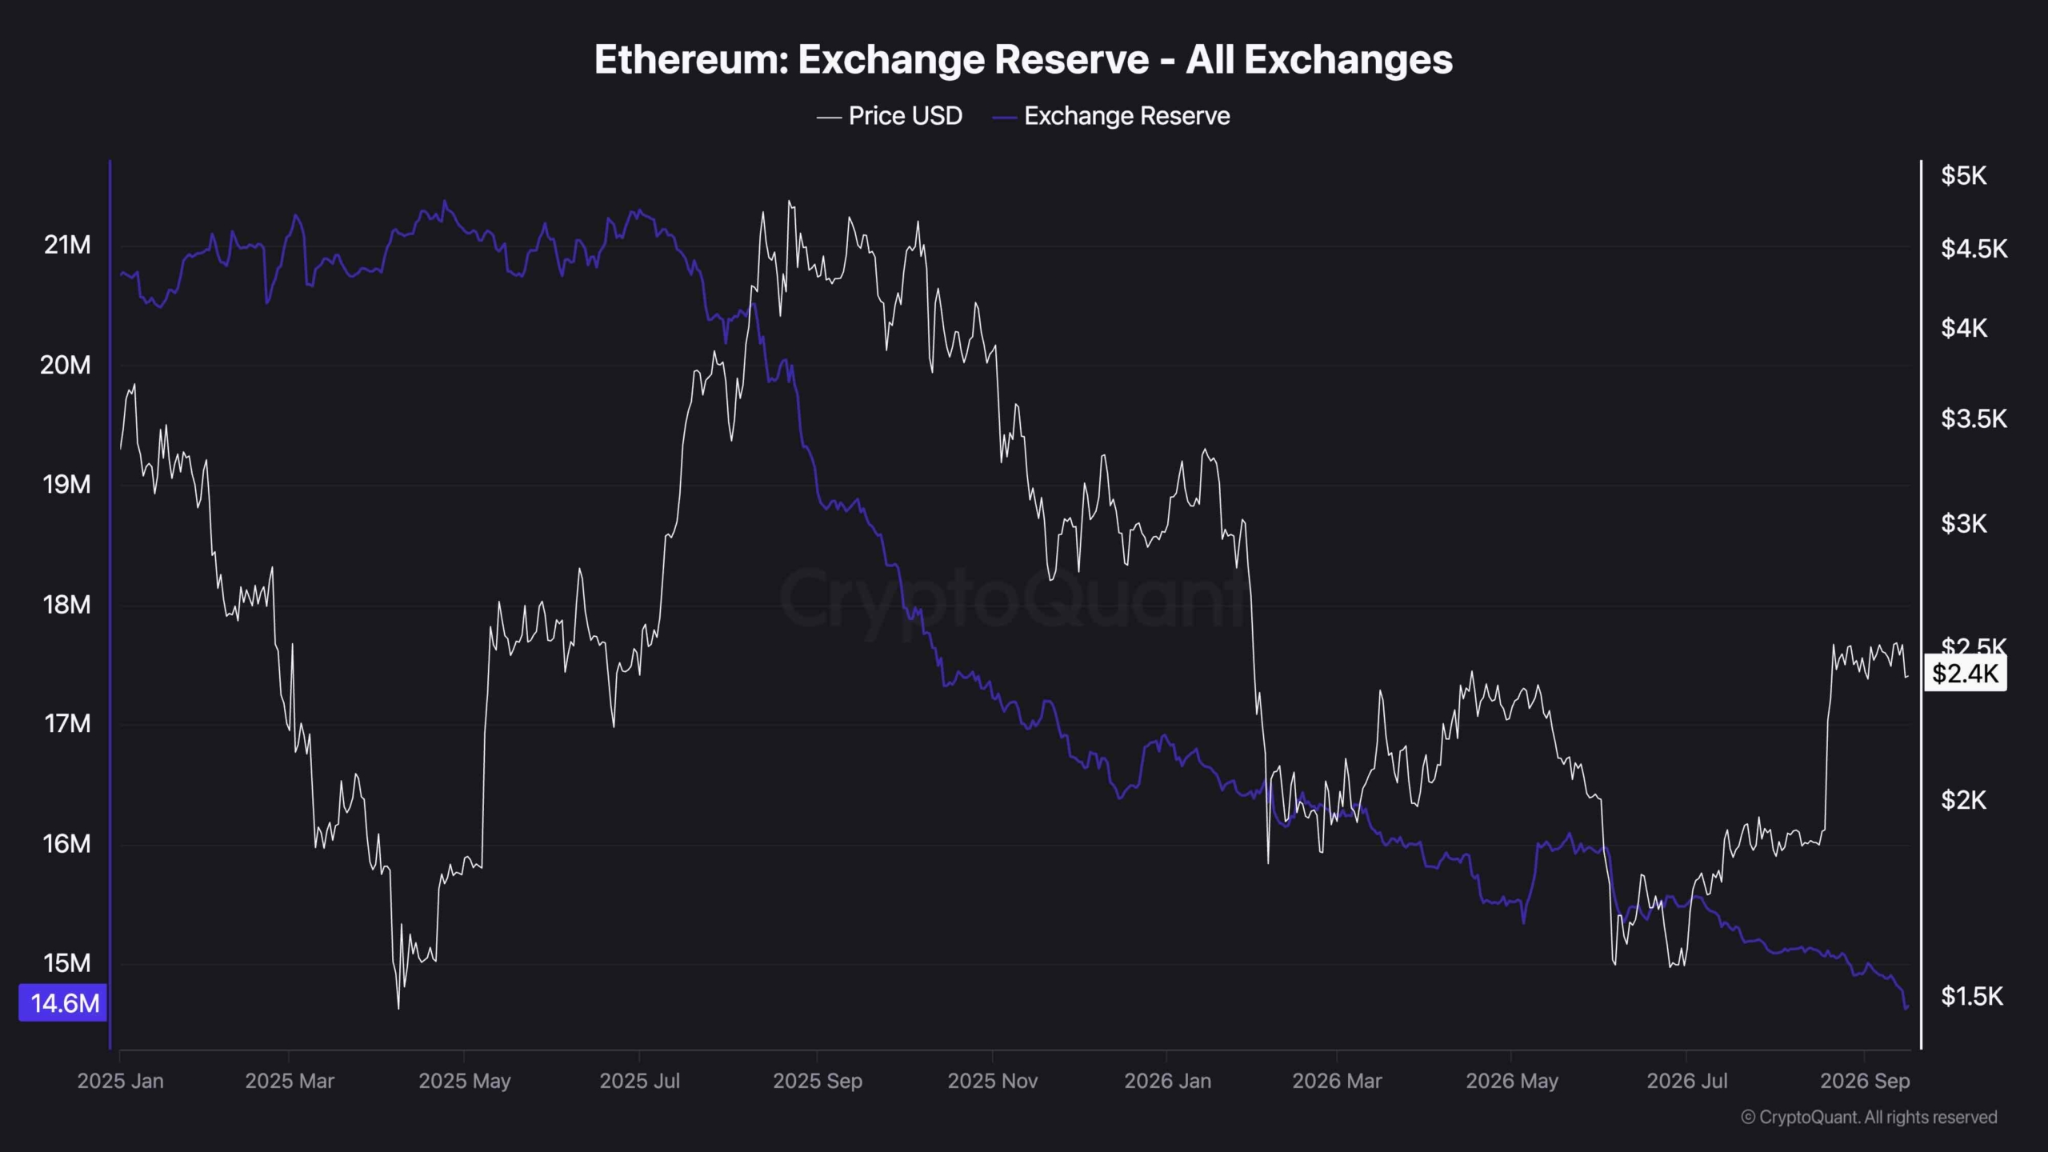
Lower exchange reserves can mean fewer coins are immediately available for sale, although the metric does not guarantee higher prices because ETH can move between exchanges, custodians, and private wallets for many reasons.
If ETH eventually breaks above $2,500 while exchange reserves remain low, reduced readily available supply could support the move.
If ETH loses $2,350 instead, declining exchange reserves alone would not prevent a deeper correction.
FOMC Guidance Remains the Main Macro Risk
The Fed raised rates by 25 basis points to 3.75%-4.00% and said inflation remains elevated. The committee also maintained a clear focus on bringing inflation back toward 2%.
Fed Chair Kevin Warsh argued that the economy is strengthening and financial conditions are not clearly restrictive.
That leaves room for further tightening if inflation does not improve. For Ethereum, higher rates create two pressures.
First, higher Treasury yields can make lower-risk assets more attractive relative to crypto. Second, a stronger US dollar can reduce liquidity across risk markets.
ETH holding above $2,400 despite that backdrop is constructive, but another round of hawkish repricing could still push Ethereum toward the bottom of its range.
Ethereum Currently in Neutral Zone
Ethereum is no longer experiencing the same momentum that drove the rapid move from below $2,000 toward $2,500, but price has also not rolled into a clear bearish trend.
The next directional signal is more likely to come from price itself. A sustained move above $2,500 would favor another expansion higher. A break below $2,350 would suggest the consolidation is resolving lower.
| Scenario | Price Trigger | Possible Outcome |
| Bullish Case | ETH holds $2.35K-$2.4K and closes above $2.5K | $2.6K retest, followed by potential move toward $3K |
| Base Case | ETH remains between $2.35K and $2.6K | Consolidation continues as markets digest the Fed decision |
| Bearish Case | ETH loses $2.35K and then $2.25K | $2K-$2.1K becomes the next major support zone |
Table 2. Ethereum Price Scenarios After the September FOMC Decision
Bottom Line
Ethereum remains in consolidation, but its broader structure has not broken.
ETH is still holding above the $2,350 to $2,400 range floor despite the Federal Reserve’s 25-basis-point rate hike and hawkish inflation guidance.
Its recent ETF flow picture has also been less negative than Bitcoin’s, with approximately $47 million in net Ethereum ETF outflows across the seven sessions from September 8 through September 16 compared with much heavier Bitcoin ETF withdrawals.
Ethereum still needs a sustained daily close above $2,500, followed by acceptance above $2,600, before the next move toward $3,000 becomes more convincing.
On the downside, $2,350 is the first level that matters. Losing that area would expose roughly $2,250. Only after those supports fail would the $2,000 to $2,100 region become the main downside target.
For now, ETH remains in a range, with the structure still holding despite a difficult macro backdrop.
This article is for informational purposes only and does not constitute financial advice. Crypto price predictions are based on analyst estimates and are not guarantees of future performance. Do your own research before making any investment decisions.
Frequently Asked Questions
Need a refresher? Here are some common questions about Ethereum’s current price setup.
Why Is Ethereum Still Below $2,500?
Ethereum has repeatedly encountered selling pressure around $2,500 after its strong August recovery. Buyers have not yet been able to establish sustained acceptance above the level, leaving ETH inside a broad consolidation range.
Is Ethereum Stronger Than Bitcoin Right Now?
Ethereum is showing greater relative price stability in the current setup, with ETH still holding its consolidation range while Bitcoin is testing more immediate support after the Fed decision. Ethereum ETF flows have also been considerably less negative over the latest seven reported sessions. However, that does not guarantee ETH will outperform Bitcoin going forward.
Could Ethereum Fall Back to $2,000?
It could, but ETH would first need to lose several nearer support areas. The current consolidation floor sits around $2,350, followed by support near $2,250. The $2,000 to $2,100 area becomes more relevant only if those levels fail.
What Price Does Ethereum Need to Break?
The first major level is $2,500. A sustained daily close above it would improve the short-term structure, while a move above roughly $2,600 would provide stronger confirmation that Ethereum is leaving its consolidation range.
How Could Further Fed Rate Hikes Affect Ethereum?
Additional tightening could keep Treasury yields and the US dollar elevated, creating a more difficult environment for Ethereum and other risk assets. Softer inflation data that reduces expectations for further rate hikes would generally ease that macro pressure.