Ethereum is trading above $2,500 after failing to hold a post-inflation rally that briefly pushed ETH to $2,665.
The move started after the August Consumer Price Index (CPI) report triggered a relief rally across risk assets. Ethereum jumped from around $2,434 to $2,665, helped by stronger whale activity and short liquidations, but sellers quickly regained control above $2,600.
The failure to hold $2,600 shifts attention back to support around $2,500. The next major macro catalyst is the September 16 Federal Open Market Committee (FOMC) decision, where markets are increasingly expecting another 25-basis-point rate hike.
Ethereum Gives Back the CPI Rally
Ethereum initially reacted positively to the August CPI report. ETH moved from around $2,434 to an intraday high near $2,665, up roughly 10%.
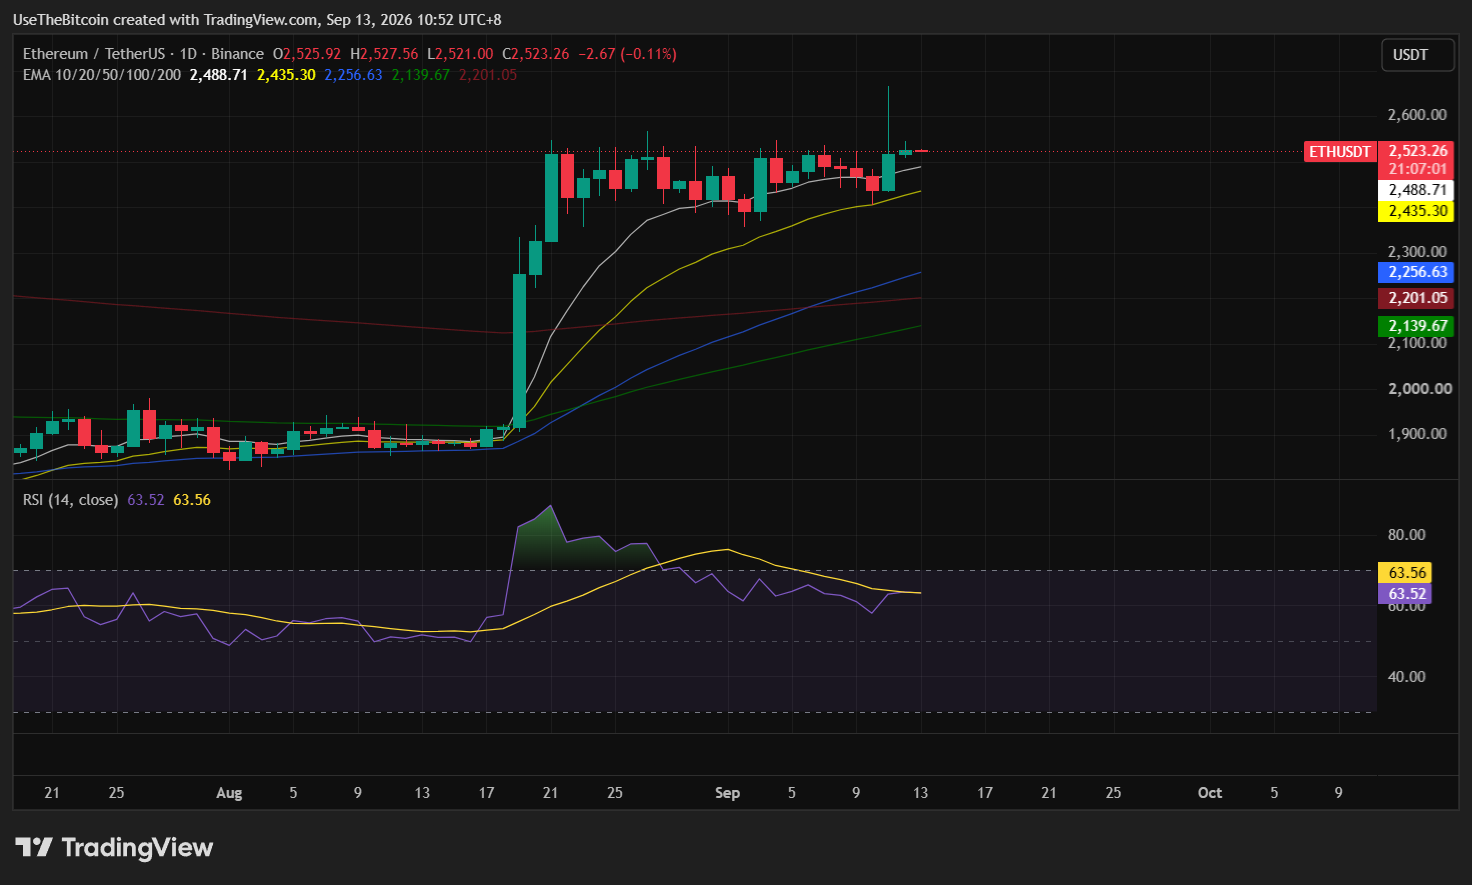
Large transactions increased during the move, while short liquidations helped accelerate the rally.
The problem was the follow-through, as Ethereum failed to hold above $2,600 and later fell back toward $2,500, suggesting the initial CPI move was driven partly by short covering and relief buying rather than a clean structural breakout.
The $2,600 area has now returned as immediate resistance. Reclaiming it would be the first sign that buyers are regaining control.
| Level | Role |
| $2,390–$2,400 | Major downside support |
| ~$2,500 | Key short-term support |
| $2,550–$2,600 | Immediate resistance |
| ~$2,665 | Recent CPI rally high |
| $2,700–$2,800 | Major supply zone |
| ~$3,000 | Larger bullish target |
Table 1. Ethereum Key Support and Resistance Levels
As long as ETH holds around $2,500, buyers still have a chance to rebuild the breakout setup. A sustained move below that level would weaken the post-CPI recovery.
$2,600 Has Become the Main Short-Term Test
The failure above $2,600 matters because Ethereum had already struggled around this area before CPI.
ETH briefly cleared the level during the rally, but sellers quickly pushed it back below. That turns $2,600 from a breakout level back into resistance.
A confirmed move above $2,600 would put the recent $2,665 high back in focus. Beyond that, Ethereum faces a heavier supply zone between roughly $2,700 and $2,800.
More than 10 million ETH previously changed hands in that area, which means some holders may use a return to those prices to exit around breakeven.
That makes $2,800 a more important confirmation level than the initial move above $2,600.
Whale Activity Rose During the Breakout
Whale activity increased as Ethereum accelerated higher after CPI.
Transactions worth more than $1 million rose by nearly 14% during the move to $2,665. That suggests larger participants became more active during the rally rather than the move being driven entirely by smaller traders.
Short liquidations also played a role. When ETH broke through resistance, traders positioned for lower prices were forced to close, adding more buying pressure.
That can make a rally move quickly, but liquidation-driven momentum is often harder to sustain without continued spot demand.
Ethereum’s pullback toward $2,500 shows the first wave of buying was not enough to establish a stable higher range.
Ethereum ETF Inflows Remain Supportive
Institutional demand also improved during the rally. US spot Ethereum exchange-traded funds (ETFs) recorded around $216.4 million in net inflows on September 11, their strongest daily result since August 27. BlackRock’s iShares Ethereum Trust ETF (ETHA) accounted for roughly $148 million of the total.
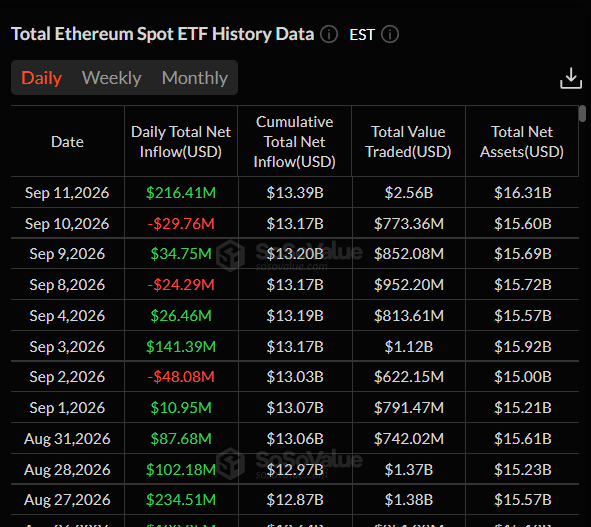
Combined Ethereum ETF trading volume reached around $2.56 billion.
| Ethereum ETF Metric | September 11 |
| Net inflows | ~$216.4M |
| BlackRock ETHA inflows | ~$148M |
| Total ETF trading volume | ~$2.56B |
| Relative result | Strongest daily inflow since Aug. 27 |
Table 2. U.S. Spot Ethereum ETF Activity on September 11
The inflows are supportive, but one strong session does not guarantee that demand will remain elevated.
If ETF inflows continue while ETH reclaims $2,600, the breakout case would strengthen. If inflows fade while price remains below resistance, the market could stay range-bound.
FOMC Is Now the Main Macro Catalyst
The Federal Open Market Committee (FOMC) meeting on September 16 is now the biggest short-term macro event for Ethereum.
Markets have increased expectations for a 25 bps rate hike after the latest inflation data. Rate-hike probabilities recently hovered around 87%, showing that tighter policy is increasingly priced in.
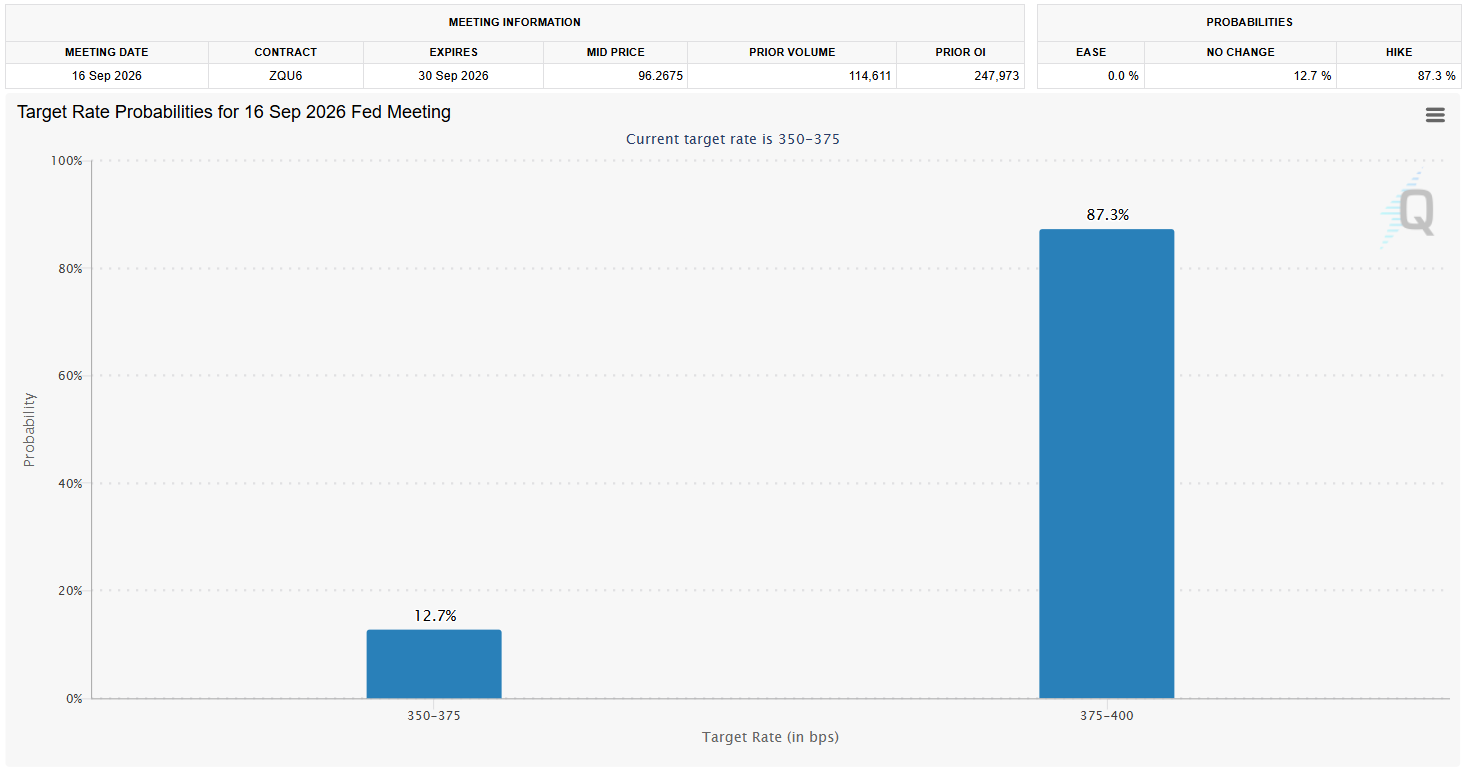
Because the hike itself is already widely expected, Ethereum’s reaction may depend more on the Fed’s guidance than the decision alone.
If policymakers raise rates but signal that further tightening will depend on incoming data, yields may stabilize, and ETH could get another opportunity to reclaim $2,600.
If the Fed remains clearly hawkish and signals more hikes, Treasury yields and the US dollar could rise, putting more pressure on Ethereum.
| FOMC Scenario | Possible Market Reaction | Possible ETH Impact |
| 25 bps hike with balanced guidance | Yields stabilize | ETH could retest $2,600-$2,665 |
| 25 bps hike with hawkish guidance | Yields and USD rise | ETH could lose $2,500 and test lower support |
| Surprise hold | Rate expectations fall | ETH could challenge $2,665 and $2,700-$2,800 |
Table 3. How the September FOMC Decision Could Affect Ethereum
The key point is that the Fed’s forward guidance may matter more than the expected 25-basis-point move itself.
Bitcoin Could Still Decide Whether ETH Breaks Higher
Ethereum’s next move also depends partly on Bitcoin. ETH can outperform for short periods, but a sustained move toward $2,800 becomes harder if Bitcoin remains stuck below major resistance.
If Bitcoin can reclaim the upper-$70,000 area and push toward $80,000, broader crypto risk appetite could improve, giving Ethereum more room to retest $2,600 and $2,667.
If Bitcoin weakens instead, Ethereum could lose $2,500 even if ETH-specific ETF flows remain supportive.
That makes the current setup a combination of Ethereum’s own resistance structure and the direction of the wider crypto market.
| Scenario | Price Trigger | Possible Outcome |
| Bullish Case | ETH holds $2,500, reclaims $2,600 and clears $2,665 | $2,700-$2,800 comes into focus, followed by $3,000 |
| Base Case | ETH stays between roughly $2,400 and $2,600 | Consolidation continues through the FOMC decision |
| Bearish Case | ETH loses $2,500 and then $2,390-$2,400 | Post-CPI breakout weakens and lower support becomes vulnerable |
Table 4. Ethereum Price Scenarios for September 2026
The current setup remains neutral until Ethereum either reclaims $2,600 or loses the support structure around $2,400 to $2,500.
Bottom Line
Ethereum’s CPI rally showed strong short-term momentum, but the failure to hold above $2,600 changes the immediate setup.
ETH briefly reached $2,665 before sellers pushed price back toward $2,500. That makes $2,600 the first level buyers need to reclaim before the recent high can be tested again.
ETF inflows and whale activity remain supportive, but the September 16 FOMC decision is now the main macro risk.
With a rate hike already heavily priced in, the Fed’s guidance on what comes next could determine whether ETH recovers above $2,600 or falls back toward $2,400.
This article is for informational purposes only and does not constitute financial advice. Crypto price predictions are based on analyst estimates and are not guarantees of future performance. Do your own research before making any investment decisions.
Frequently Asked Questions
Need a refresher? Here are some common questions about Ethereum’s current price setup.
Why Did Ethereum Rally After the CPI Report?
Ethereum initially rallied because headline inflation came broadly in line with expectations, creating a relief move across risk assets. Rising whale activity and short liquidations then helped push ETH from around $2,434 to $2,665.
Why Did Ethereum Fall Back Below $2,600 After Rallying?
The rally failed to attract enough follow-through buying above $2,600. Short-covering helped accelerate the initial move, but sellers returned around $2,600 to $2,667 and pushed ETH back toward $2,500.
Why Is $2,600 Important for Ethereum?
The $2,600 area was resistance before the CPI rally and became resistance again after ETH failed to hold above it. Reclaiming the level would improve the short-term structure and put $2,665 back in focus.
How Could the FOMC Decision Affect Ethereum?
The Federal Open Market Committee can affect ETH through interest rates, Treasury yields, and the US dollar. A rate hike with hawkish guidance could pressure Ethereum, while balanced guidance could reduce macro pressure and help ETH retest resistance.
Could Ethereum Still Reach $2,800?
Yes, but ETH would first need to reclaim $2,600 and break above the recent $2,665 high. A sustained move through the $2,700 to $2,800 supply zone would provide much stronger confirmation of a larger bullish breakout.