
Ethereum recorded 989,500 daily active addresses on August 9, 2026, the highest single-day total since March, according to data from Santiment, even as ETH’s price remained largely flat between $1,870 and $1,875 over the same period.
The Numbers Behind the Spike
ETH opened August 10 at $1,917.68, touched a high of $1,932.34 and a low of $1,908.07, and traded near $1,875.80 as of that evening, down 2.33% over the prior 24 hours, with a market capitalization around $226.37 billion and roughly $9.1 billion in 24-hour trading volume.
However, wallet-level activity jumped sharply while the price barely moved, which, according to Santiment’s analysis, signals that capital is being redeployed across the network.
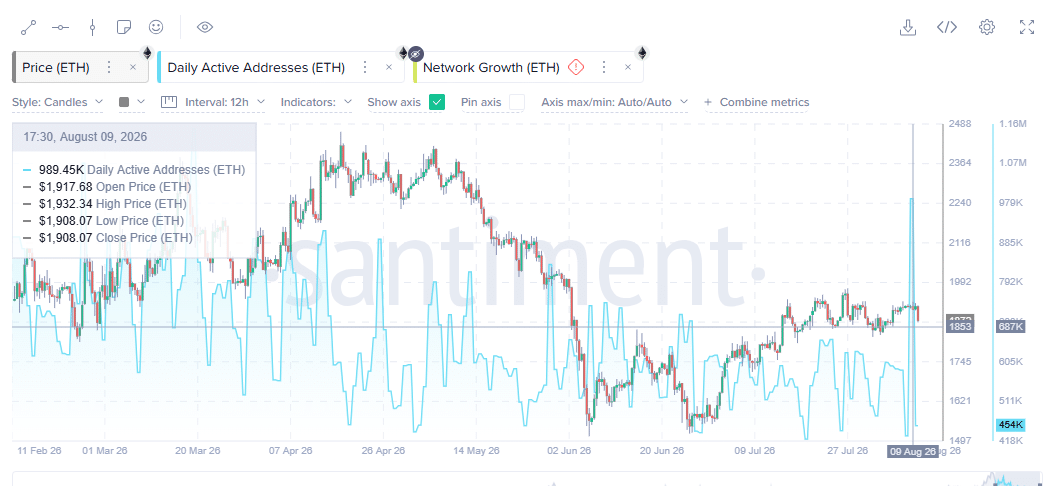
Santiment specifically noted that many of the active addresses driving the spike appear to belong to older wallets rotating positions rather than to new users entering the network for the first time.
That distinction matters for how durable this looks. If the increase is concentrated among wallets that were already active rather than among genuinely new participants, sustaining an elevated address count going forward would likely require fresh capital to enter from outside the existing set of holders.
Santiment’s own charts covering the period from February through early August show active addresses fluctuating throughout the spring and summer before rising sharply on August 9, with network growth metrics registering similarly elevated levels over the same window.
What Might Be Contributing, and What Isn’t Confirmed
US spot Ethereum ETFs recorded $244.94 million in net inflows for the week of August 3 to 7, according to SoSoValue data, extending a streak of five consecutive positive weeks, with BlackRock’s ETHA accounting for the largest share at roughly $203 million.
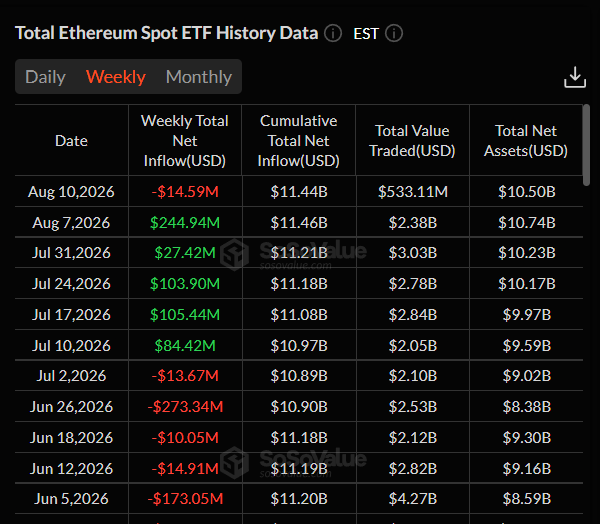
A further single-day inflow of 29,900 ETH, worth about $56.78 million, came on August 10, bringing cumulative net inflows since launch to near $11.46 billion.
Robinhood Chain, the Ethereum layer-2 network covered in our earlier reporting on its first month of activity, has also seen increased transaction volume since its public launch, with early data showing hundreds of millions of dollars in bridged ETH and elevated daily transaction counts, as the network settles to Ethereum and uses ETH for gas.
To be precise about what this data does and doesn’t show, both ETF inflows and Robinhood Chain’s activity are real, well-documented trends happening at the same time as the address spike, but neither has been established as a direct cause of it based on the available data, therefore treating both as plausible contributing context rather than a confirmed explanation for why wallet activity jumped specifically on August 9.
Lower mainnet gas fees and improved layer-2 throughput may also play a supporting role since smaller wallets that typically pull back during fee spikes tend to return once transacting on the network becomes economically viable again for smaller balances.
The Broader Backdrop
Ethereum continues to lead other blockchains in weekly developer activity, with new tools and applications still being built even as competition from other layer-1 networks increases, providing some floor for network usage independent of short-term speculation.
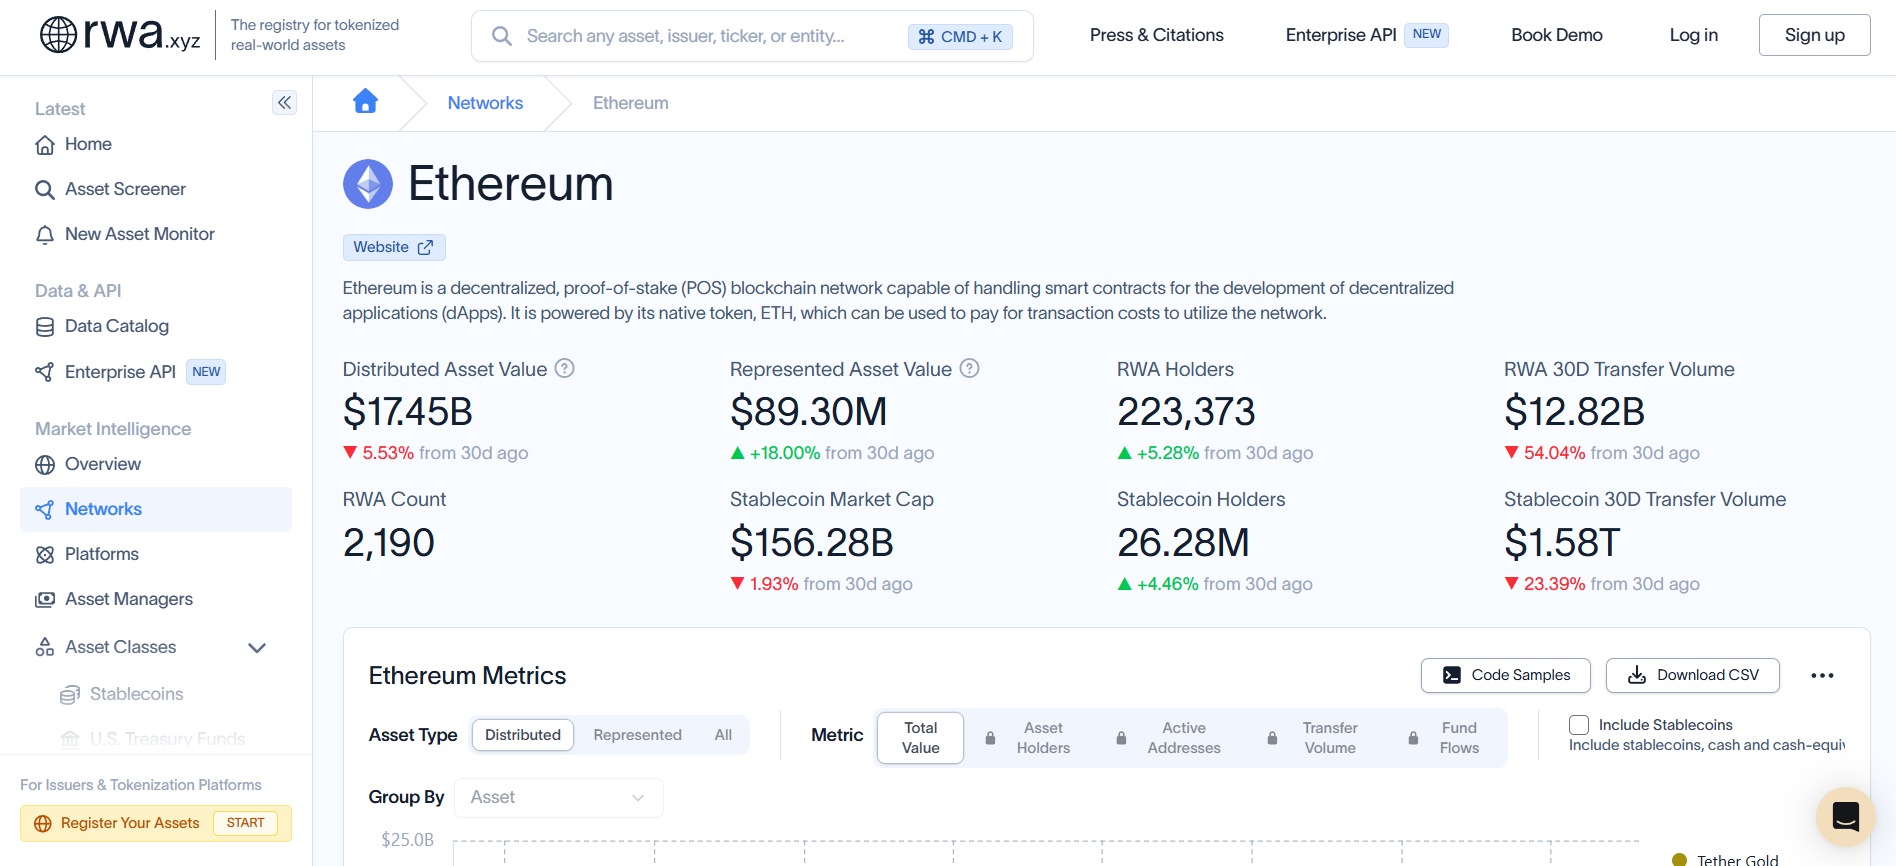
Distributed real-world asset value on Ethereum recently sat at around $17.45 billion, according to RWA.xyz data, part of a broader on-chain RWA market that the network continues to dominate, while stablecoin transfer volumes on the network have remained in the hundreds of billions of dollars each month.
US regulatory developments have also kept institutional attention on Ethereum as a settlement layer for regulated, on-chain finance, including the ongoing debate in Washington over crypto market-structure legislation.
What Comes Next
What this means for you: a jump in active addresses without a corresponding move in price is a signal worth watching rather than acting on immediately, since Santiment’s own data suggests existing wallets rotating positions are driving most of this increase rather than a wave of new users.
Whether this activity sticks and eventually shows up in price, or fades as quickly as it appeared, likely depends on whether fresh capital starts entering the network rather than just existing holders repositioning within it.