
Bitcoin is trading near $84,300 after a sharp rejection from above $87,000 erased part of its latest rally and triggered a wave of leveraged long liquidations.
The pullback follows a strong recovery from approximately $75,000, with Bitcoin gaining around 13% over the previous week before running into heavier supply. BTC briefly reached above $87,000 on September 23 but fell as low as $83,508 after buyers failed to hold the breakout.
The broader recovery remains intact while Bitcoin holds above the $80,000 to $82,000 area. However, the failed move through $87,000 shows that the $86,000 to $90,000 region is now the main test. A sustained breakout above $89,000 to $90,300 would strengthen the case for another leg higher, while a drop to $80,000 could send BTC back toward $75,000 to $78,000.
Bitcoin Pulls Back After Failing Above $87K
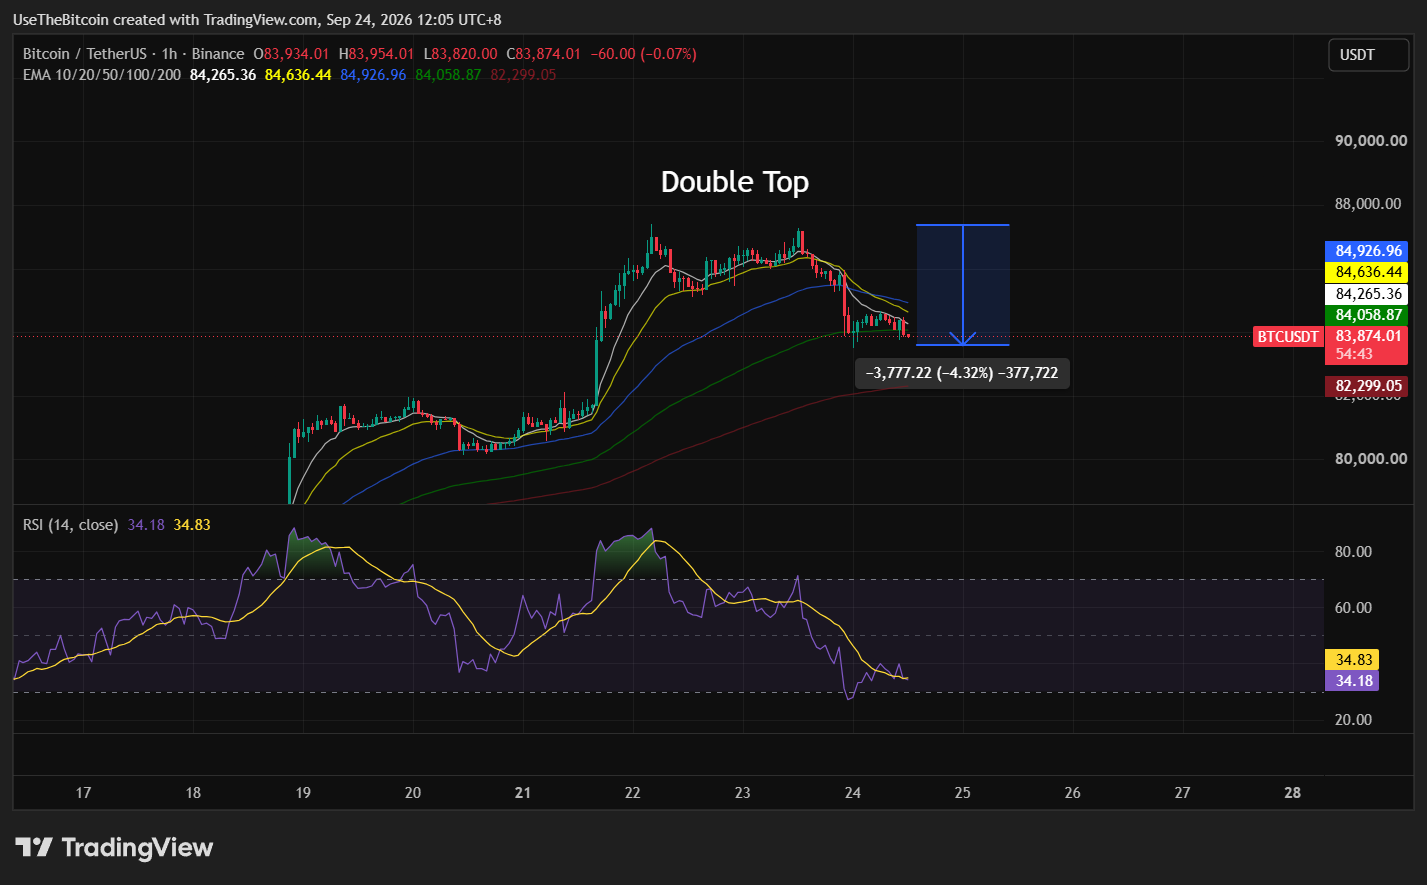
Bitcoin entered September 23 with strong momentum after rebounding from approximately $75,000 and breaking through previous resistance around $80,000 to $82,000.
The rally pushed BTC above $87,000 twice, but buyers failed to maintain the move. The price then fell rapidly to an intraday low near $83,508 before recovering above $84,000.
Bitcoin was in the overhead supply zone between approximately $86,000 and $89,000, and $80,000 to $82,000 could be the first major demand area if the pullback continues.
| Level | Role |
| $75,000-$78,000 | Major secondary support |
| $80,000-$82,000 | Main breakout support |
| ~$83,500 | Sept. 23 intraday low |
| ~$84,300 | Current price area |
| ~$86,000-$87,000 | Immediate resistance |
| $88,000-$90,000 | Major supply zone |
| ~$90,300 | Upper profit-taking band |
Table 1. Bitcoin Key Support and Resistance Levels
BTC does not need to immediately return above $87,000 to preserve the recovery. Holding the $80,000 to $82,000 region would keep the higher-low structure intact following the rebound from $75,000.
$86K to $90K Is Bitcoin’s First Major Resistance Test
Bitcoin’s latest rally has reached an area where several technical and onchain resistance levels overlap.
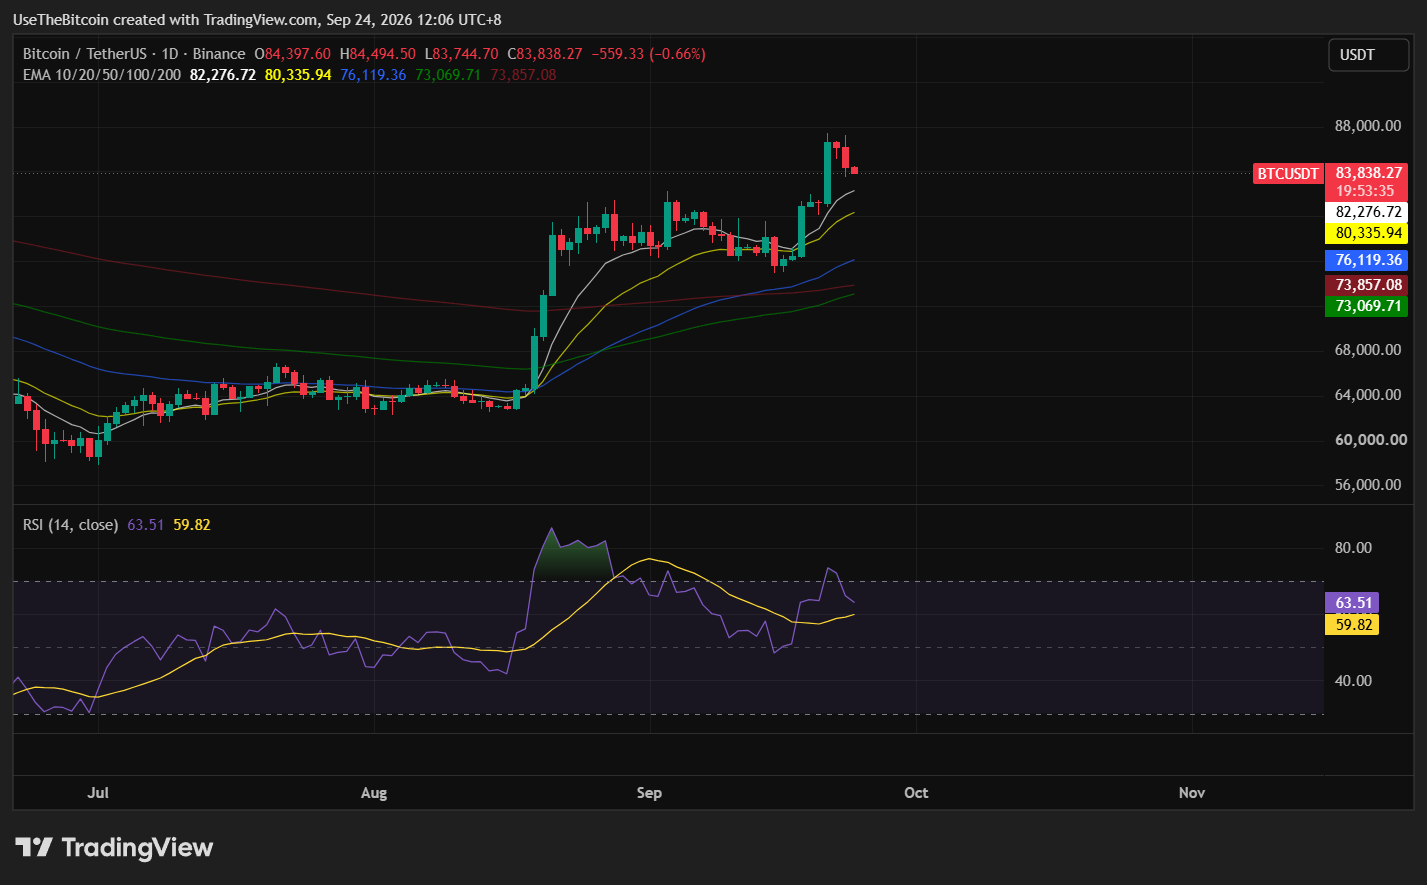
The daily chart shows substantial supply between approximately $86,000 and $89,000. BTC has already struggled to hold above the lower end of that range, with the September 23 rejection occurring shortly after price moved through $87,000.
Onchain holder cost bases add another layer of resistance. CryptoQuant data shows the realized price of Bitcoin held for roughly 18 months to two years sits near $88,000, while the six-to-12-month cohort is positioned around $90,000.
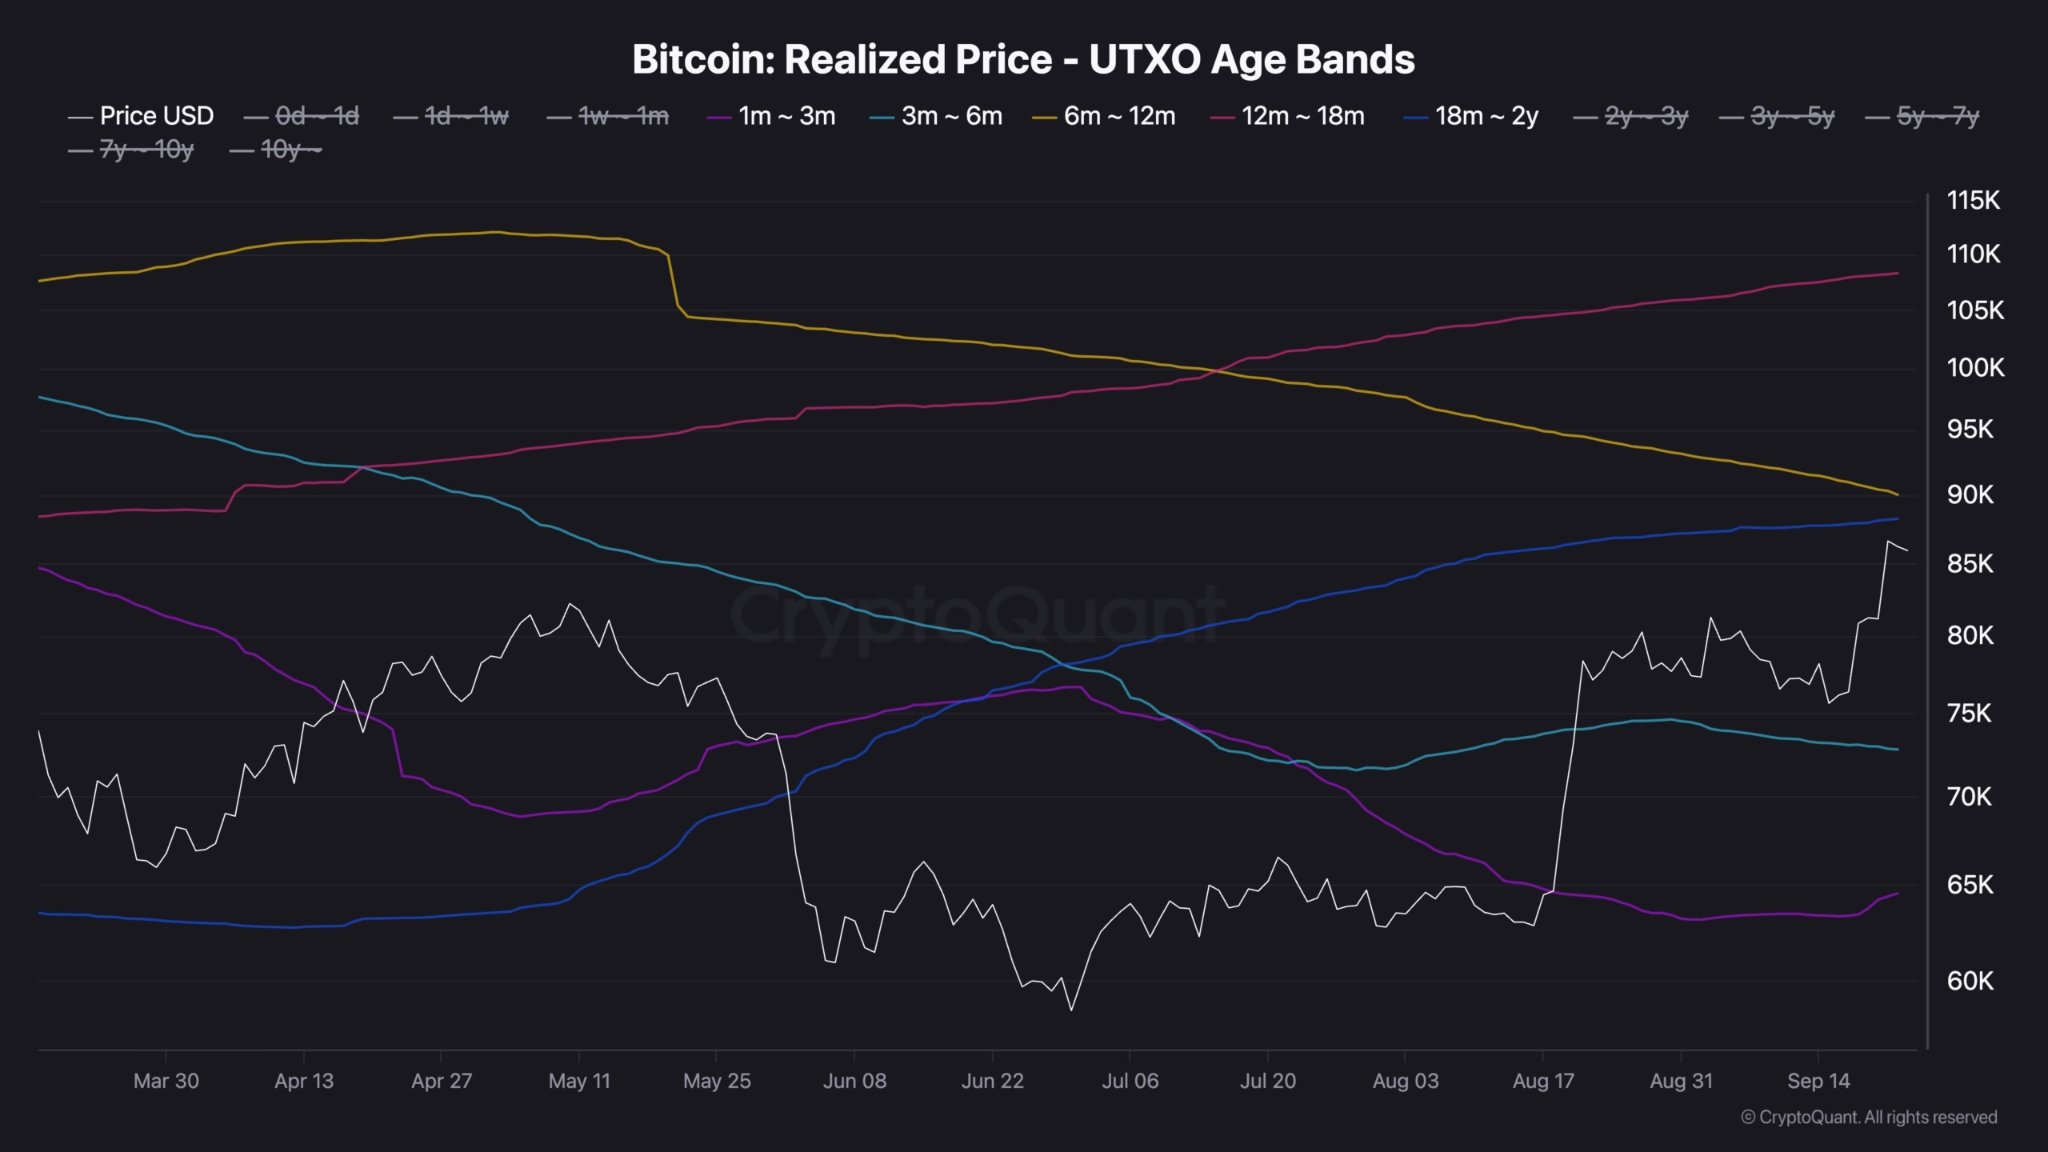
As BTC approaches those levels, some holders returning toward break-even may choose to sell. A sustained move through $89,000 would clear much of that immediate supply cluster. The next test would then sit around $90,300.
$90.3K Marks an Upper Profit-Taking Band
CryptoQuant’s weekly report places the upper profit-taking band for Bitcoin’s one-to-three-month holder cohort near $90,300.
The cohort’s average realized price is approximately $64,300, while the upper band sits roughly 40% above that cost basis. As Bitcoin approaches the upper range, unrealized profits increase, and some short-term holders may begin realizing gains.
The $90,300 level also overlaps with the broader $88,000 to $90,000 supply cluster.
That makes $90,000 more than a psychological round number. Several groups of existing holders would be moving deeper into profit at roughly the same time Bitcoin reaches a technically important resistance area.
A clean break above $90,300 would therefore provide stronger evidence that buyers are absorbing the available supply rather than simply extending a short-term rebound.
Long Liquidations Accelerated the Drop Below $84K
Notably, the September 23 decline was amplified by leveraged positioning. Bitcoin’s rejection from above $87,000 initially developed gradually, but selling accelerated once BTC fell through $86,000. Price then dropped roughly $2,000 within about 30 minutes and reached $83,508.
More than $230 million in leveraged Bitcoin long positions were liquidated within a single hour as BTC fell below $84,000.
Across the broader session, long-side liquidations became the dominant source of forced position closures after short sellers had absorbed much of the pressure during the preceding rally.
The $80K to $82K Zone Is Now the Main Support
Bitcoin’s first major downside test sits below the current price around $80,000 to $82,000. This area previously acted as resistance before BTC accelerated toward $87,000. It now needs to function as support if the breakout structure is going to remain intact.
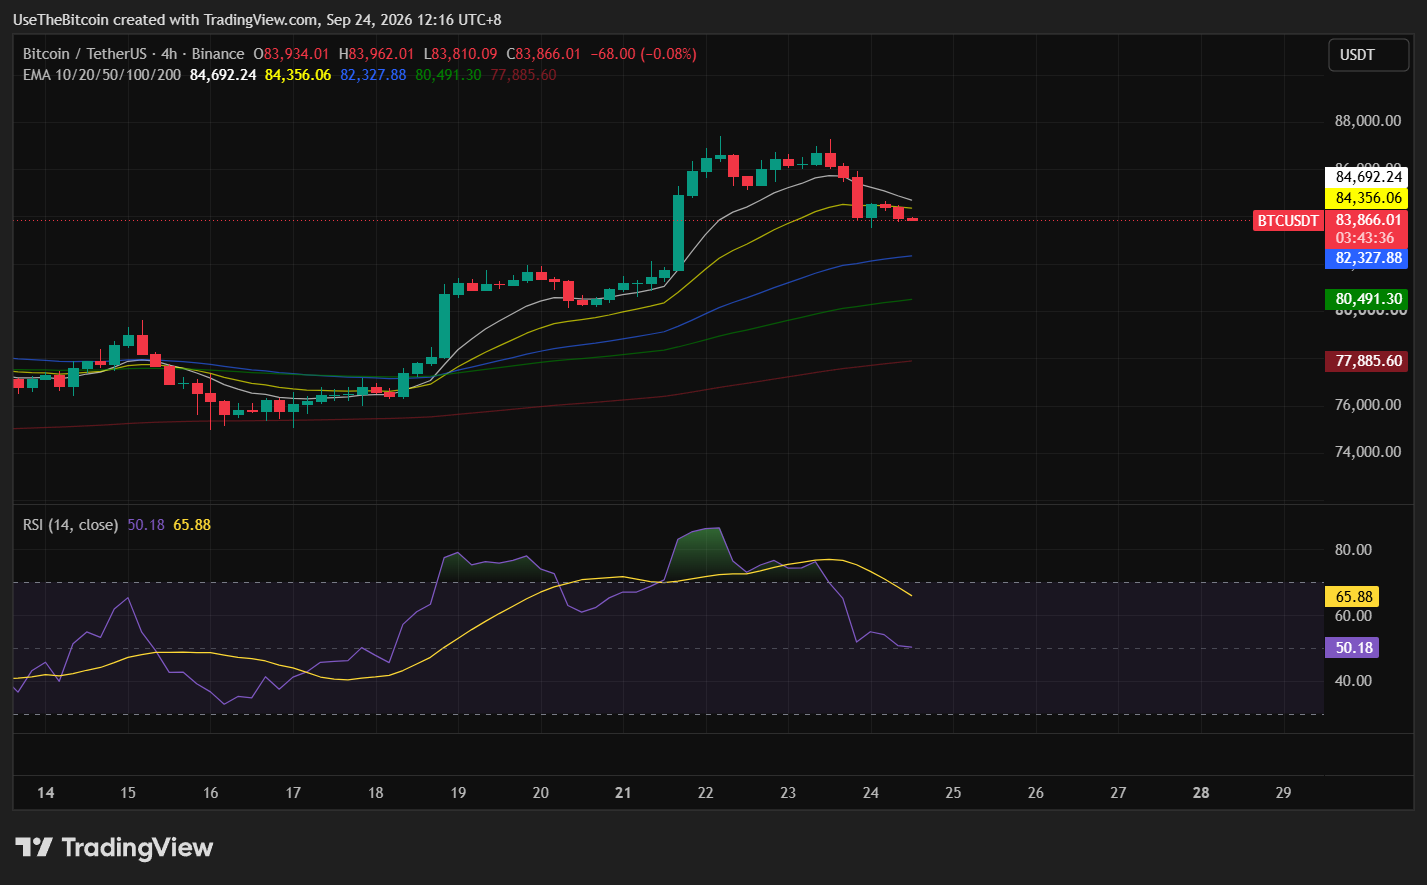
The four-hour chart also shows the rising trendline from the $75,000 low remaining intact. A pullback toward $80,000 to $82,000 that attracts buyers would preserve that higher-price sequence.
A sustained breakdown below $80,000 would make the recovery less convincing and expose the next demand zone around $75,000 to $78,000. That means the September 23 drop below $84,000 is not yet a full technical reversal. BTC still has another major support layer beneath the current price.
$84K Is Short-Term Support, but $80K Matters More
Bitcoin’s quick recovery above $84,000 after touching $83,508 gives the market an immediate reference point. However, $84,000 is not the strongest structural support in the current setup.
BTC traded through that level quickly during both the rally and the pullback. The more established demand area sits around $80,000 to $82,000, where the previous consolidation occurred before the latest breakout.
That creates a clearer hierarchy: $84,000 as the immediate level to defend, $80,000 to $82,000 as the main breakout support, and $75,000 to $78,000 as the deeper demand zone if the current recovery structure fails.
On the upside, BTC must first reclaim $86,000 to $87,000 before another attempt at $89,000 to $90,300 becomes likely.
| Scenario | Price Trigger | Possible Outcome |
| Bullish Case | BTC reclaims $87K and closes above $89K | $90.3K becomes the next major test, with further upside possible if supply is absorbed |
| Base Case | BTC remains between $80K and $89K | Consolidation follows the 13% recovery while leverage resets |
| Bearish Case | BTC loses $80K | $75K-$78K becomes the next major demand area |
Table 2. Bitcoin Price Scenarios After the $87K Rejection
Bottom Line
Bitcoin’s recovery from $75,000 remains technically intact, but the rejection above $87,000 confirms the next stage will be harder than the initial rebound.
The most important downside area is $80,000 to $82,000. Holding it would preserve the breakout structure and give buyers another opportunity to challenge resistance.
On the upside, Bitcoin needs to reclaim $86,000 to $87,000 before attacking the larger $88,000 to $90,000 supply zone.
A sustained close above roughly $90,000 would strengthen the continuation setup, but a drop to $80,000 would shift attention back toward $75,000 to $78,000.
This article is for informational purposes only and does not constitute financial advice. Crypto price predictions are based on analyst estimates and are not guarantees of future performance. Do your own research before making any investment decisions.
Frequently Asked Questions
Need a refresher? Here are some common questions about Bitcoin’s current price setup.
Why Did Bitcoin Fall Below $84,000?
Bitcoin fell after failing to hold above $87,000. The rejection pushed BTC through nearby support and triggered forced liquidations among leveraged long positions, accelerating the decline to approximately $83,508.
What Is Bitcoin’s Most Important Support Level?
The main support zone is approximately $80,000 to $82,000. It previously acted as resistance before Bitcoin’s latest breakout and now needs to hold to preserve the short-term recovery structure.
Why Is $90,000 Important for Bitcoin?
The $88,000 to $90,000 area contains both technical resistance and several onchain holder cost bases. CryptoQuant also places the one-to-three-month holder cohort’s upper profit-taking band near $90,300, where selling pressure could increase.
Is Bitcoin’s Rally Over After the $87K Rejection?
The rejection has weakened short-term momentum, but BTC remains above the main $80,000 to $82,000 breakout support. A breakdown below $80,000 would create stronger evidence that the recovery is failing, while reclaiming $87,000 to $89,000 would improve the setup.
What Happens if Bitcoin Breaks Above $90,000?
A sustained breakout through approximately $89,000 to $90,300 would clear the current technical supply zone and an important cluster of holder cost bases. The market would then need to establish the former resistance as support before a larger continuation could be considered confirmed.