
XRP is trading near $1.30 after falling sharply from the $1.40 area, leaving the token at an important technical support cluster around $1.25 to $1.28.
The pullback followed two major market events as the United States Senate failed to advance the CLARITY Act on September 15 in a 49-50 procedural vote, falling short of the 60 votes needed to move the legislation forward. One day later, the Federal Open Market Committee (FOMC) raised interest rates by 25 basis points to 3.75% to 4.00% while maintaining a strong focus on elevated inflation.
XRP’s chart has weakened after those events, but the broader recovery has not completely broken. Price remains above the 50-day exponential moving average (EMA) near $1.284 and the 100-day EMA near $1.256, while US spot XRP exchange-traded funds (ETFs) have continued attracting net inflows.
The $1.25 to $1.28 zone is now the main battleground, and holding those levels could allow XRP to rebuild toward $1.35 to $1.40. A confirmed breakdown would increase the risk of a deeper decline toward $1.10.
XRP Tests the $1.28 Support Zone
XRP is trading around $1.298 after failing to maintain its September recovery above $1.40.
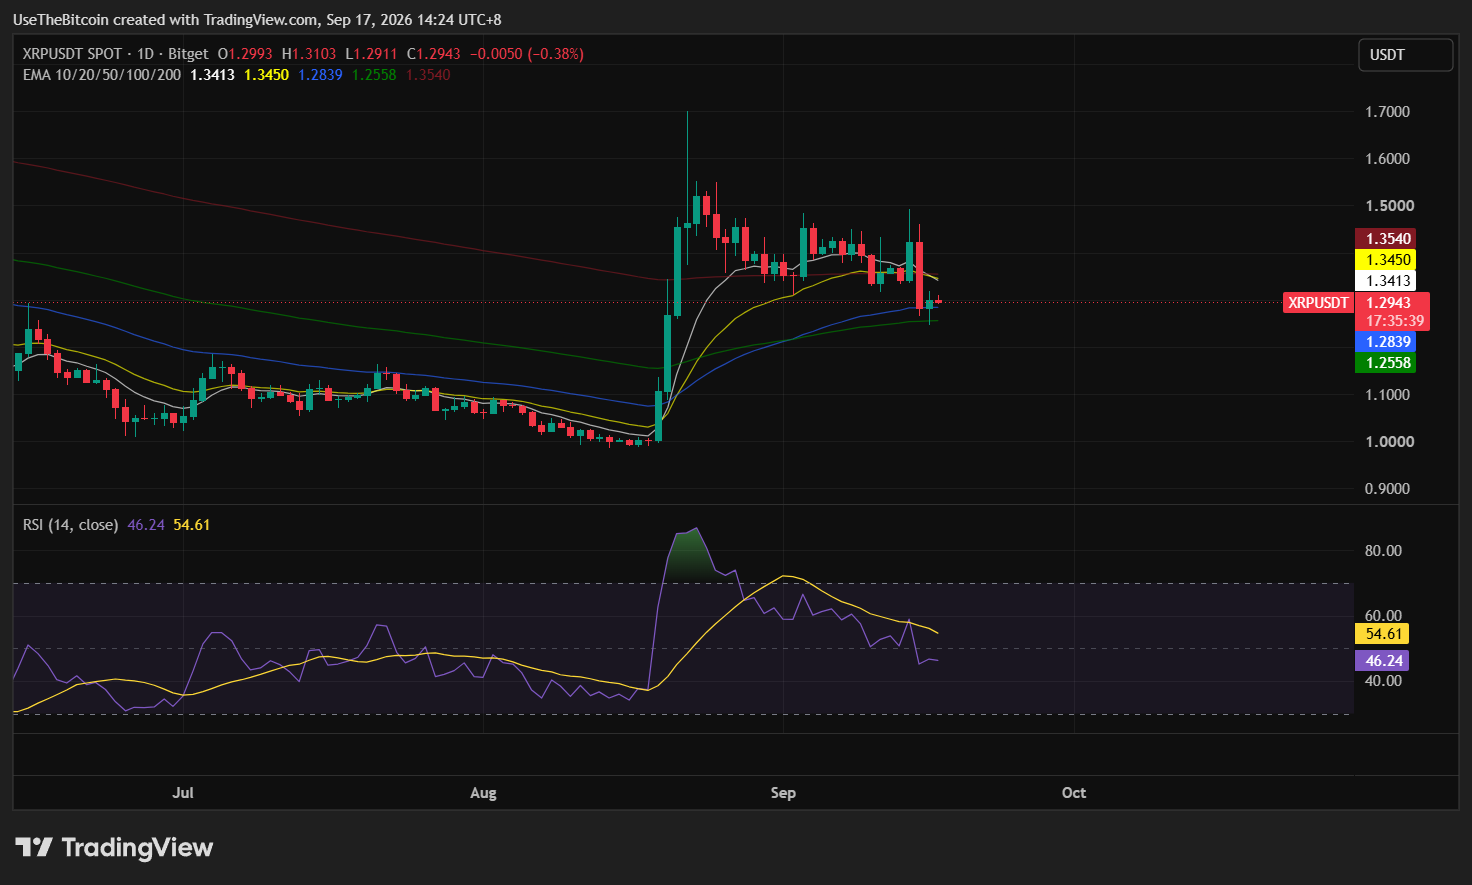
The daily chart shows price below the 10-day EMA at roughly $1.342, the 20-day EMA at $1.345, and the 200-day EMA near $1.354. Those three averages now create a concentrated resistance area between roughly $1.34 and $1.36.
However, XRP remains just above the 50-day EMA at $1.284 and the 100-day EMA at $1.256.
| Level | Role |
| ~$1.10-$1.12 | Larger downside target |
| $1.25-$1.28 | Main support zone |
| ~$1.298 | Current price area |
| $1.34-$1.36 | EMA resistance cluster |
| $1.38-$1.40 | Breakout confirmation zone |
| ~$1.55 | Major upside resistance |
Table 1. XRP Key Support and Resistance Levels
$1.2829 is considered to be an immediate support, followed by approximately $1.2543 to $1.2569 if that level fails.
The current setup is therefore more nuanced than a simple bearish breakdown. XRP has lost its short-term moving averages but is still sitting directly above two longer-term support averages.
A recovery above $1.34 to $1.36 would put XRP back above the major moving-average cluster.
A daily close below $1.25 would produce a much clearer deterioration because price would lose both the 50-day and 100-day support areas.
The daily relative strength index (RSI) is around 46, which is below the neutral 50 level but still well above oversold territory.
CLARITY Act Defeat Added Regulatory Pressure
XRP entered the week expecting the CLARITY Act to advance in the Senate. Instead, the September 15 cloture vote failed 49-50. The motion required 60 votes, meaning the Senate did not proceed to full consideration of the legislation.
The vote does not reverse XRP’s existing regulatory treatment or the previous Ripple court rulings, but it delays a broader federal framework covering digital asset markets.
XRP fell sharply on the setback, dropping from its previous range near $1.40 toward the current $1.28 to $1.30 area.
The price reaction shows that traders had attached value to broader regulatory progress even though the legislation was not specifically required to determine XRP’s existing legal status.
Near-term price action is now being driven more by whether buyers defend technical support than by expectations for another immediate Senate vote.
FOMC Hike Adds Another Layer of Pressure
The recent FOMC meeting raised the federal funds target range by 25 basis points to 3.75% to 4.00% on September 16.
The Fed said economic activity remains solid and inflation remains elevated, with the committee emphasizing its commitment to returning inflation to the 2% target.
The rate hike affects XRP through the same channels weighing on Bitcoin and Ethereum.
Higher rates can push Treasury yields higher, strengthen the US dollar, and reduce demand for risk assets. Reuters reported that the dollar reached a seven-week high after the Fed decision as markets priced in further tightening.
For XRP, that macro pressure arrived immediately after the CLARITY Act setback, leaving the token exposed to both regulatory disappointment and tighter financial conditions. Yet XRP has so far avoided a decisive breakdown below $1.25.
XRP ETF Flows Remain Positive Despite the Selloff
SoSoValue data shows XRP ETFs recorded another $3.50 million in net inflows on September 16.
The funds also attracted $11.26 million on September 14, $5.14 million on September 10, and $12.29 million on September 9.
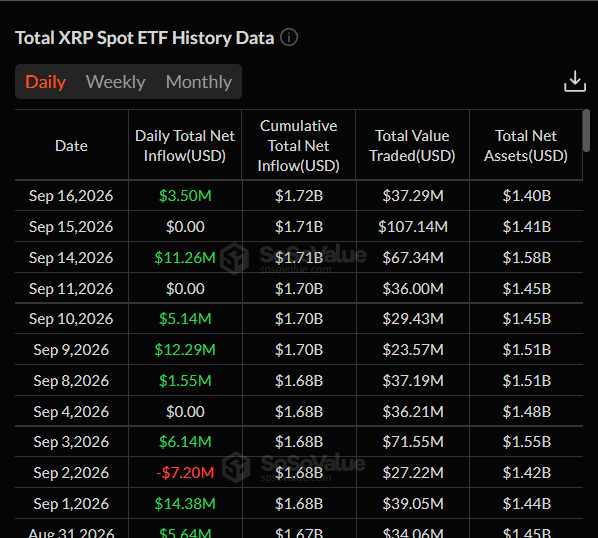
Across the visible September 1 through September 16 sessions, XRP ETFs generated approximately $47.06 million in net inflows.
Cumulative net inflows increased from about $1.68 billion at the beginning of September to $1.72 billion by September 16. However, XRP has fallen toward $1.30 amidst the ETF demand.
Overall, ETF spot inflow data does not guarantee $1.28 will hold, but persistent inflows can provide underlying spot demand if broader crypto conditions stabilize.
The next signal would be whether ETF inflows continue during a break below $1.28. If they remain positive during deeper weakness, institutional demand would look more persistent. If ETF flows turn negative as support fails, the downside setup would strengthen.
Falling Open Interest Shows Leverage Has Been Flushed
XRP’s derivatives market has also reset significantly, as open interest (OI) reached more than $10 billion during the earlier rally but fell to about $2.89 billion by September 16, down more than 70% from the peak.
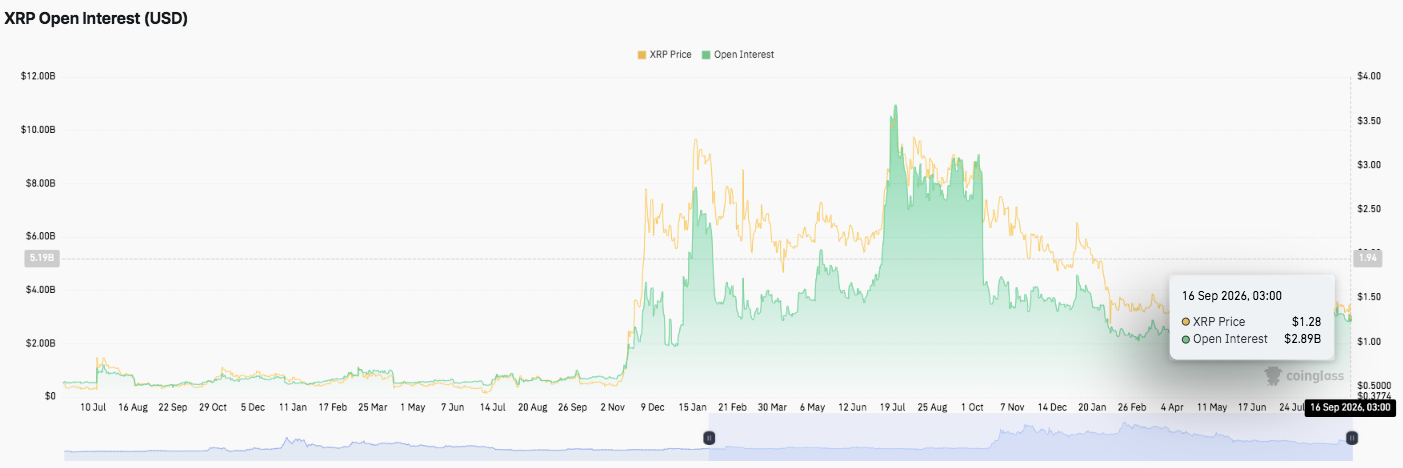
Lower open interest means considerably less leveraged positioning remains in the market, which reduces the risk of another large liquidation cascade, but it also shows speculative demand has cooled substantially.
A healthier recovery would ideally combine rising price with gradually increasing open interest rather than a sudden leverage spike while XRP remains below resistance.
Bottom Line
XRP is sitting at one of its most important support zones since the August rally.
With the CLARITY Act’s failed Senate vote and the Fed’s 25-basis-point rate hike, it eventually created a difficult two-day backdrop for XRP and the crypto market as a whole.
On the optimistic side, XRP just needs more than a bounce above its key levels to confirm that buyers have regained control.
| Scenario | Price Trigger | Possible Outcome |
| Bullish Case | XRP holds $1.25-$1.28 and reclaims $1.38-$1.40 | $1.50-$1.55 comes back into focus |
| Base Case | XRP stays between $1.25 and $1.40 | Consolidation continues while the market absorbs the CLARITY Act and FOMC outcomes |
| Bearish Case | XRP closes below $1.25 | $1.10-$1.12 becomes the next major downside area |
Table 2. XRP Price Scenarios After the CLARITY Act and FOMC Decisions
This article is for informational purposes only and does not constitute financial advice. Crypto price predictions are based on analyst estimates and are not guarantees of future performance. Do your own research before making any investment decisions.
Frequently Asked Questions
Need a refresher? Here are some common questions about XRP’s current price setup.
Why Did XRP Fall After the CLARITY Act Vote?
The Senate failed to advance the CLARITY Act in a 49-50 procedural vote on September 15, lowering expectations for near-term US crypto market-structure legislation. XRP was already under technical pressure, and the regulatory setback contributed to a broader crypto selloff.
What Is the Most Important XRP Support Level?
The main support zone is approximately $1.25 to $1.28. XRP’s 50-day EMA sits near $1.284, while its 100-day EMA is around $1.256. A daily close below the area would strengthen the bearish setup.
Could XRP Fall to $1.10?
A move toward $1.10 to $1.12 becomes more likely if XRP confirms a breakdown below $1.25 to $1.28. The area is the measured target from the recent symmetrical-triangle breakdown, but XRP has not reached that confirmation yet.
Are XRP ETF Flows Still Positive?
Yes. Based on the SoSoValue data, US spot XRP ETFs generated approximately $47.06 million in net inflows across the visible September 1 through September 16 sessions. Cumulative net inflows reached about $1.72 billion.
What Price Does XRP Need to Reclaim?
The first resistance cluster sits around $1.34 to $1.36, where the 10-day, 20-day, and 200-day EMAs are concentrated. A stronger recovery would require XRP to break above approximately $1.38 to $1.40, which could reopen the path toward $1.50 to $1.55.