Bitcoin support and resistance levels are very important for technical traders. Investors that follow the market and would like to know when to buy or sell Bitcoin should focus on all the most important support and resistance levels.
In this guide, we will tell you all the things that you should know about Bitcoin support and resistance levels. They are very important, especially for those investors that make decisions taking into consideration the evolution of Bitcoin price in the charts.
What are Bitcoin Support and Resistance Levels?
Bitcoin support and resistance levels are key price regions that would help the price of Bitcoin remain above a certain threshold or make it difficult for BTC to break higher. These support and resistance levels provide valuable information to investors that use technical analysis to make investment decisions.
Let’s get into the details of each of these support and resistance levels for Bitcoin.
What are Support Levels?
A support level is a price that would help the price of Bitcoin remain above a certain threshold. This happens because, at this specific price level, there is an increasing number of investors buying Bitcoin. Hence, if sellers want to push the price lower, they will find strong buying pressure from market and limit orders.

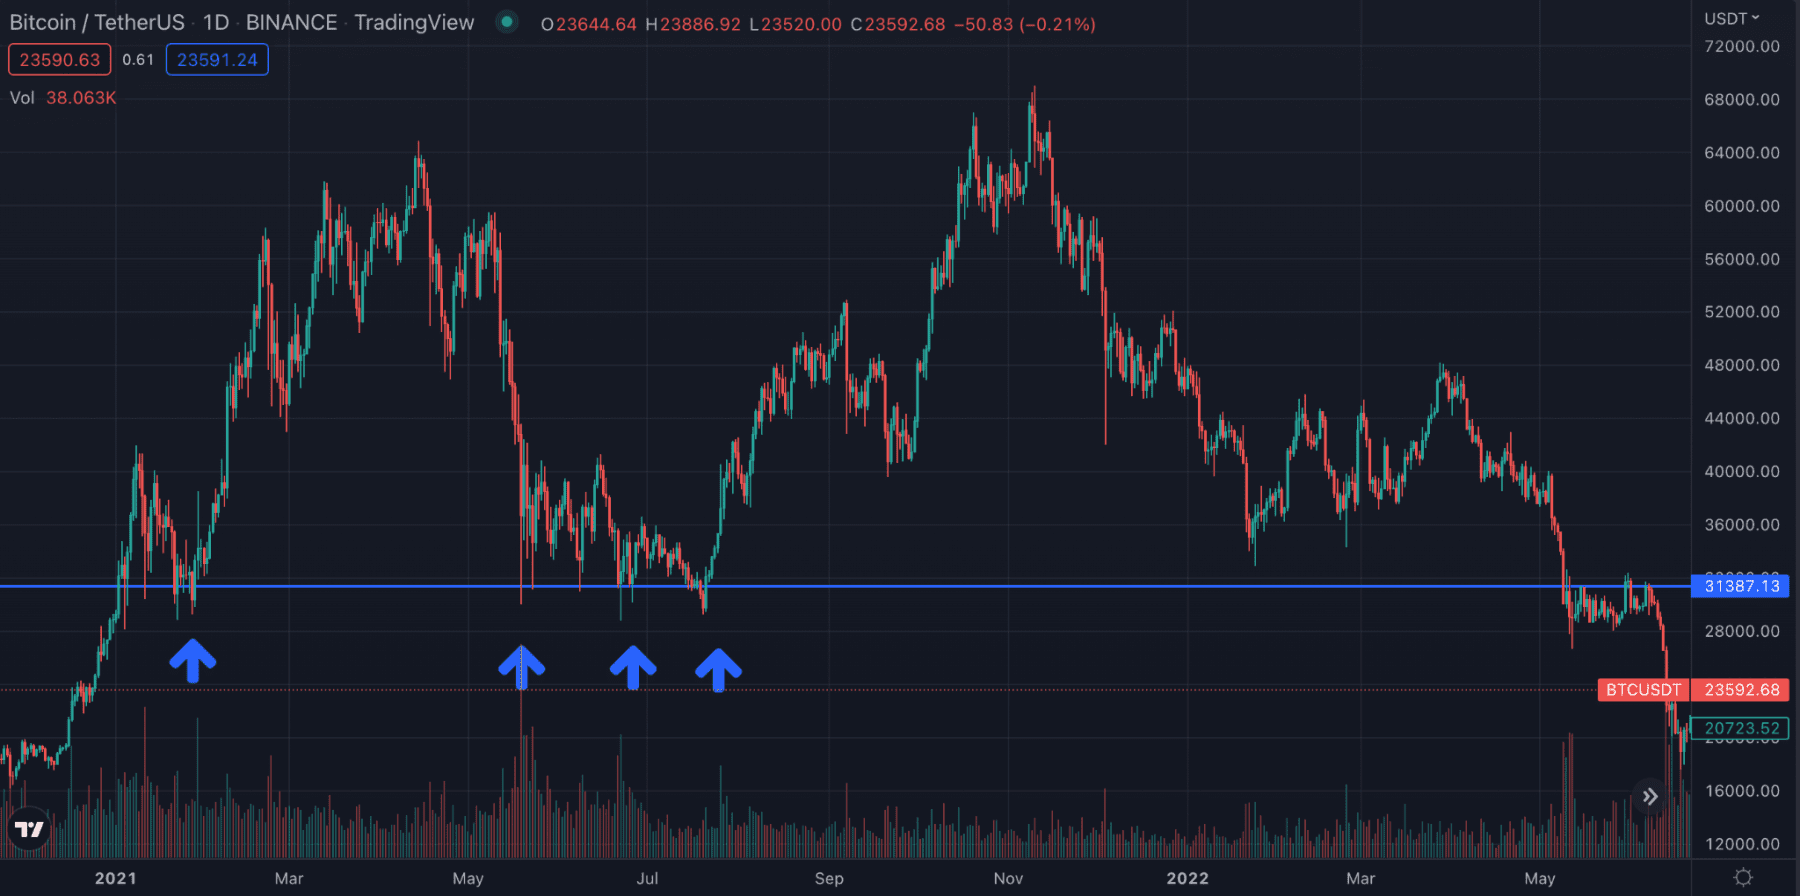
As you can see in this image, there have been different periods of time in which a certain price level worked as support. In this case, every single time that Bitcoin price got closer to $31,400, the price struggled to continue to move lower. As we explained before, this is due to the fact that there is an instant reaction from the market that considers that at this price, it could be a good moment to buy Bitcoin.
This can be done in two different ways. The first way in which investors create support levels is by opening limit buy positions close to these levels. When the price gets closer to these levels, there is not enough selling pressure to break these buy orders. The second way is by opening market orders. This happens as investors know that at these levels, there is a strong buying pressure that gets even stronger with new market orders being placed by investors.
If we now have a look at the volume, we also see that it tends to increase close to these levels. This shows that there is a large interest from investors to enter the market at these levels. Large amounts of BTC are exchanged when that happens, and therefore, this price region gets confirmed as a support level.
This does not mean, however, that support levels are unbreakable. Indeed, these buy walls can be eaten by sellers if the pressure to move the market lower is strong. At the same time, we could have a situation in which the price of Bitcoin breaks below an important support level but recovers in a short period of time.
What are Resistance Levels?
It is now time to talk about Bitcoin resistance levels. Resistance levels are also key for investors that analyse the charts and place different bets in the market. So what are resistance levels?
Resistance levels are a price where Bitcoin would find it difficult to move higher. This happens because, at this specific price level, there is an increasing number of investors selling Bitcoin. Hence, if buyers want to push the price higher, they will find strong selling pressure from market and limit orders.
As you can see, the definition is very similar to Bitcoin support levels. This is exactly the contrary situation to support regions. While the market wants to move higher, sellers try to take control of the situation and sell BTC because they consider that it is a good moment to do so.

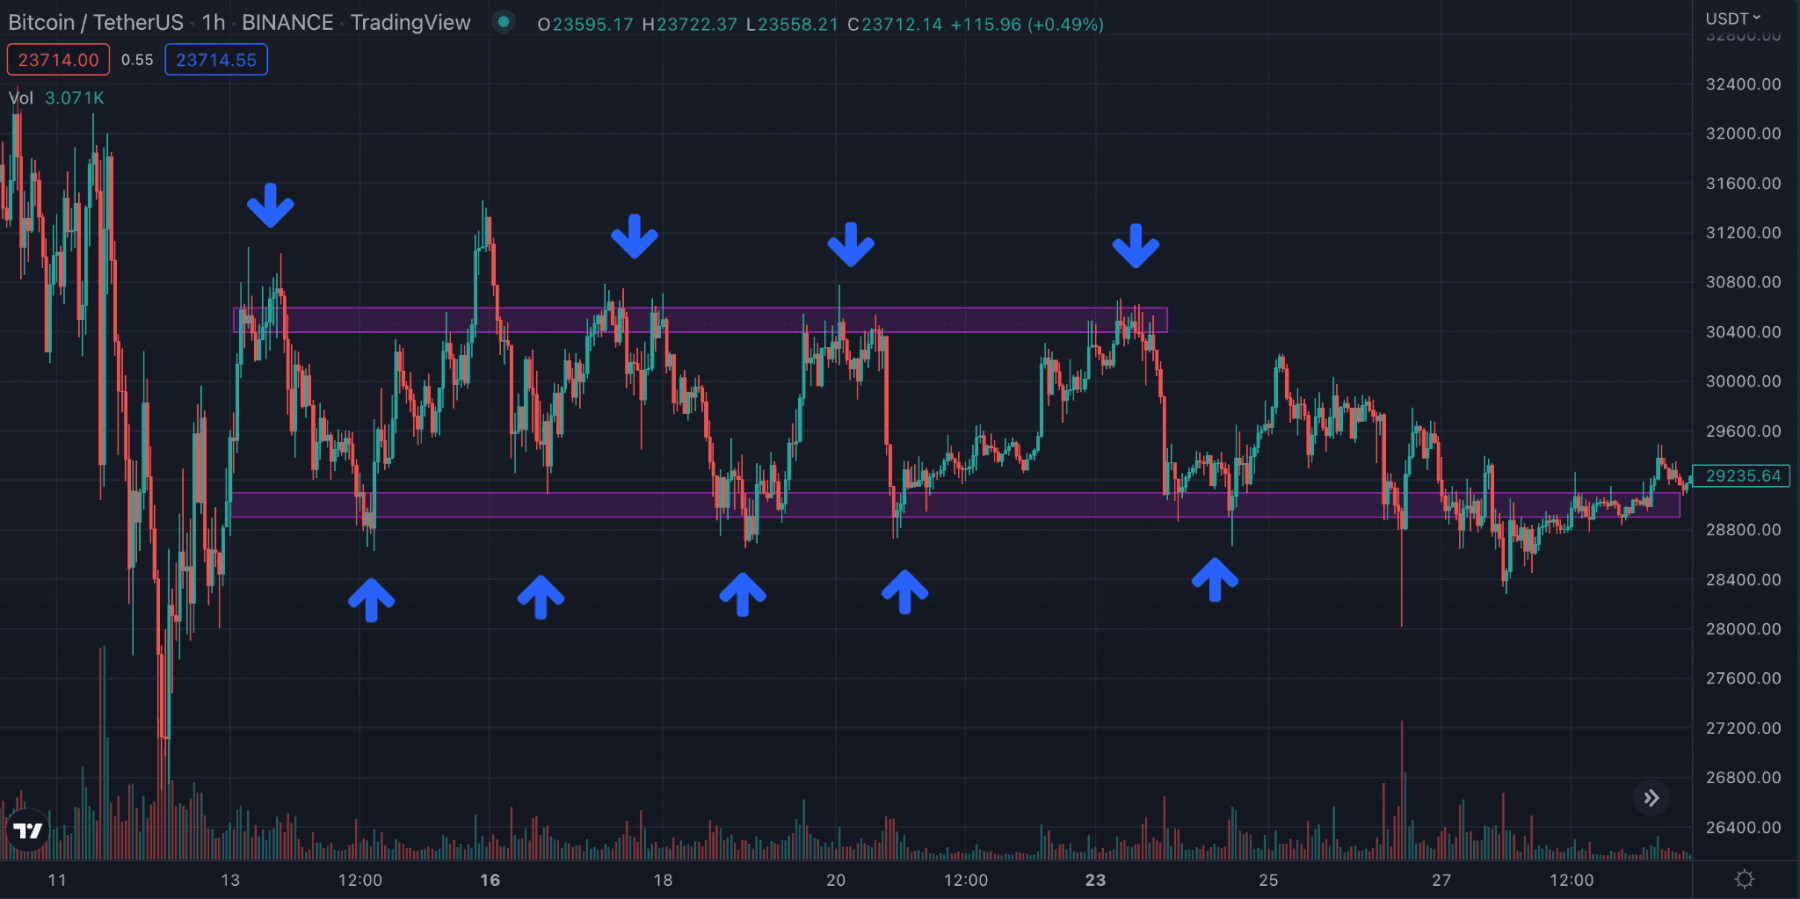
In this image, we see that Bitcoin entered a parallel channel with clear support and resistance levels. These support and resistance levels do not have to be at a specific price, but they could represent regions. In the case shown above, we see that there are two clear areas of support and resistance.
This is a good example of how a trader could find these patterns and trade them. However, it is never easy to do so and it requires investors to look at many other patterns, indicators, and possible fundamental things that could create a good trading opportunity.
Traders should also know that opening stop-loss positions at support and resistance levels might be risky in some cases.
In the example above, if a person placed a stop loss exactly at resistance when the market moved higher 1% or 2%, they would already have their position close at a loss, when they could have waited for the price of BTC to enter in the channel once again. Usually, the market tends to liquidate those traders that place stop loss orders at key support and resistance levels.
Current Support and Resistance Levels in Bitcoin
Support and resistance levels change at all times. Depending on the time frame that you use, there could be long-term support and resistance levels and short-term support and resistance levels. Understanding which are the current Bitcoin support and resistance levels ia very important for traders.

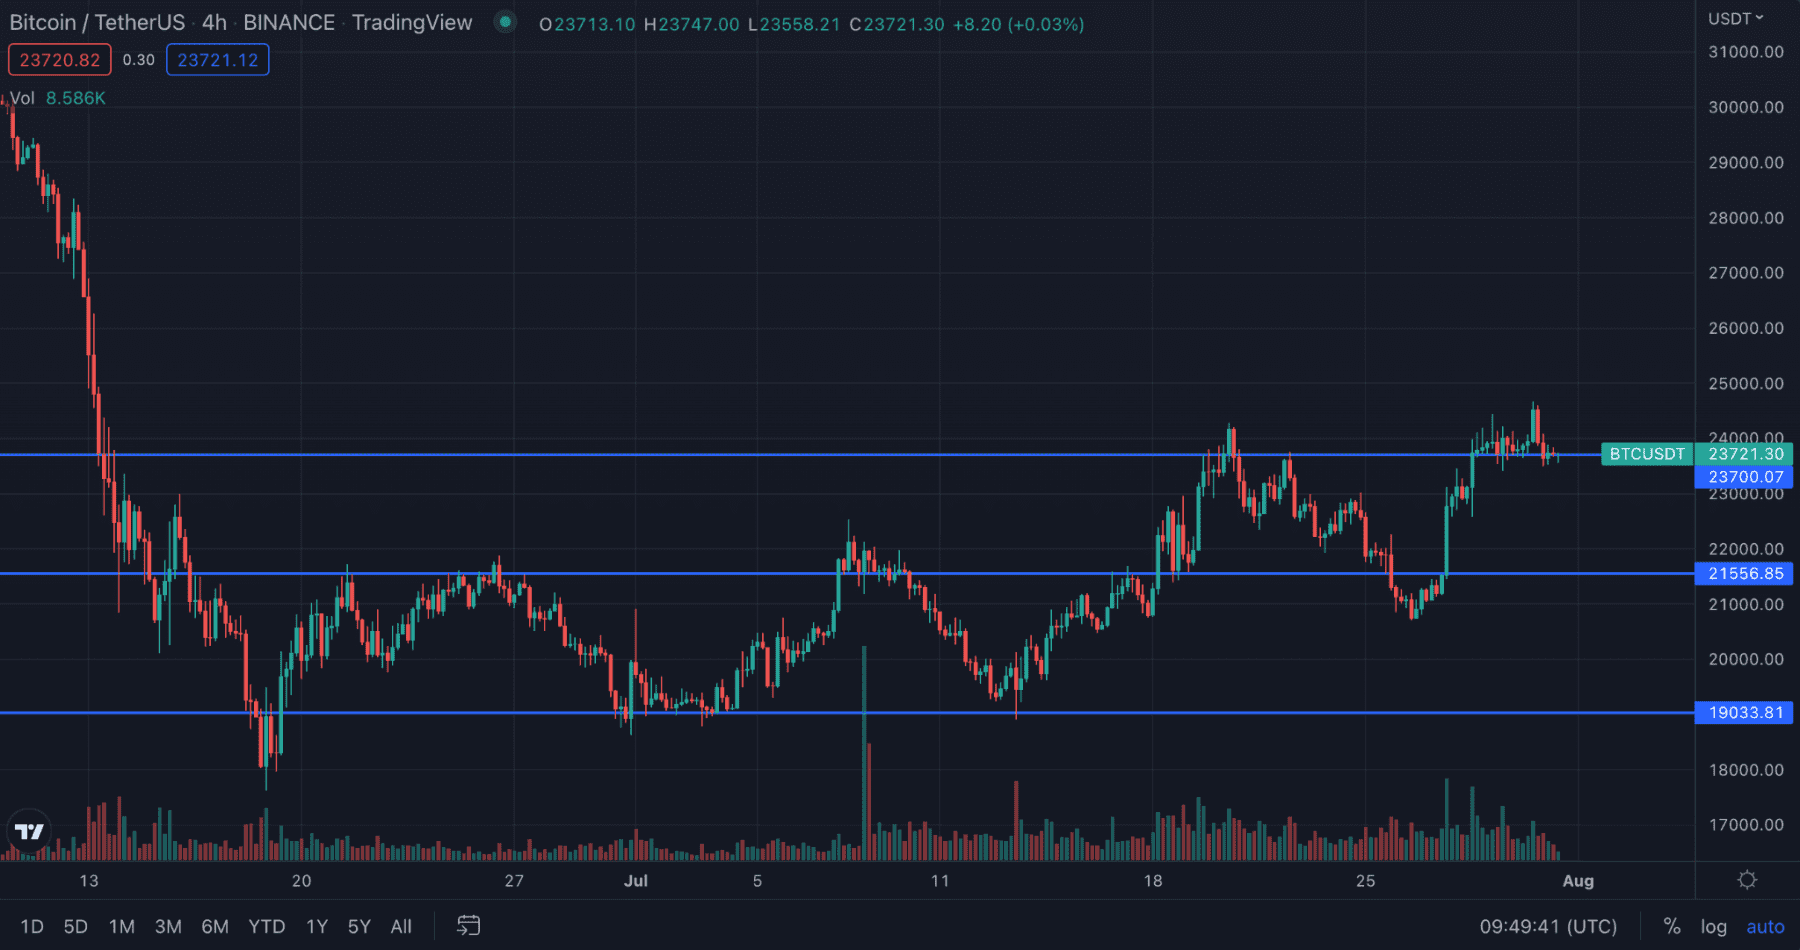
In the most recent 4-hour Bitcoin chart, we see that there are key support and resistance levels. It is not always to find these price regions, therefore, you should make sure to take the necessary time to find them.

As you can see, you can use different indicators to find support and resistance levels. It depends on your trading strategies and which indicators you use to spot support and resistance levels. Another thing that you should take into consideration is the fact that the best way to spot these support and resistance levels is by using multiple indicators.
At the moment, we see that there are three main support and resistance levels for Bitcoin. The first support level is around $19,000. This could be a region, therefore, we could be talking about a price between $18,900 and $19,100.
The second support level is $21,550. But again, this could also represent a region that is located between $22,000 and $21,000.
Now, Bitcoin is fighting with a support/resistance level between $23,700 and $24,100. Hence, we could see Bitcoin being rejected from here and coming back to the $22,000 to $21,000 price region in the near future. Things could get better for the largest cryptocurrency in the market if the coin starts to move higher and breaks above the current resistance level.
Make sure that you analyse Bitcoin and other virtual currencies taking into consideration many different things rather than just Bitcoin support and resistance levels. Take into consideration that these Bitcoin support and resistance levels could change in the future.
This is not financial advice. We are not financial advisers. All the information shared in this post and by UseTheBitcoin is for educational purposes only. We are not responsible for any investment decision you make after reading this post.
How to find Bitcoin Support and Resistance Levels?
Finding Bitcoin support and resistance levels is not an easy task. It might be for some people and traders that have experience in the market, but it requires you to know many things. You need to try using many different indicators and confirm many times that the levels that you have found are indeed Bitcoin support and resistance levels.
Talking with other investors, reading others’ charts, and making your own trading strategies could be good ways to improve your aim at spotting support and resistance levels. That being said, there are some key indicators that would make it easier for you to find these price regions. Despite that, it is always a good thing to perform different analyses and confirm once and again that the price regions that you found are indeed Bitcoin support and resistance levels.
Volume Profile
Let’s start with the volume profile indicator. The volume profile is a charting indicator that gives information about the traded volume of a specific asset (in this case Bitcoin). Rather than having the volume information at the bottom of the chart and within the X axis, you will get valuable information about the traded volume for Bitcoin at specific prices.
As we have seen in previous sections of this post, the volume at a certain price level is something that helps us understand where there could be some support and resistance levels. With the volume profile, we can see and better analyse which could be some of the price regions that could work as support and resistance levels.
By using this indicator and mixing it with Fibonacci retracement and extension levels, horizontal lines, and previous support and resistance levels, you should be able to identify key price levels for Bitcoin and other digital currencies as well. Take into account that this Bitcoin support and resistance levels guide would be also useful for other types of assets in the market.
Key Psychological Levels for Bitcoin
Another way to spot Bitcoin support and resistance levels is by analysing key psychological levels that were very important in the past or that could play an important role in the future. If we think about past Bitcoin performance, we could think of $20,000. This was Bitcoin’s all-time high in 2017 and it could have been a difficult price to break (therefore, becoming a resistance psychological level).
In the future, we could think of $69,000 as a resistance level, where Bitcoin found a top during the bull market of 2021. It might be difficult to break this price level in the future.
$20,000 was also a support level for Bitcoin when the market trended downwards in 2022. Bitcoin stayed close to this level, despite the fact that it dropped below it for a short period of time. Immediately after, buyers entered the market and helped the Bitcoin price recover in just weeks.
Psychological levels play out better if we use other technical indicators such as volume profile or Fibonacci extension and retracement levels. In this way, we can get more accurate information when analysing the charts.
Previous Support and Resistance Levels
A common thing in financial markets is for a support level to become resistance if the price of the asset falls below it, and resistance levels become support if the price of the asset moves above it. This is a general rule that applies not only to Bitcoin but to many other assets.
This happens because the market wants to bring the price to the previous support/resistance level. If the level was properly broken, then the price would not be able to come back to its previous stage.
Analysts know that when a support or resistance level is broken, there is going to be a period in which the price will try to re-test it. This will confirm the breakout or bring the price of the asset back to where it was before trying to break that price level.
Fibonacci Retracement and Extension Levels
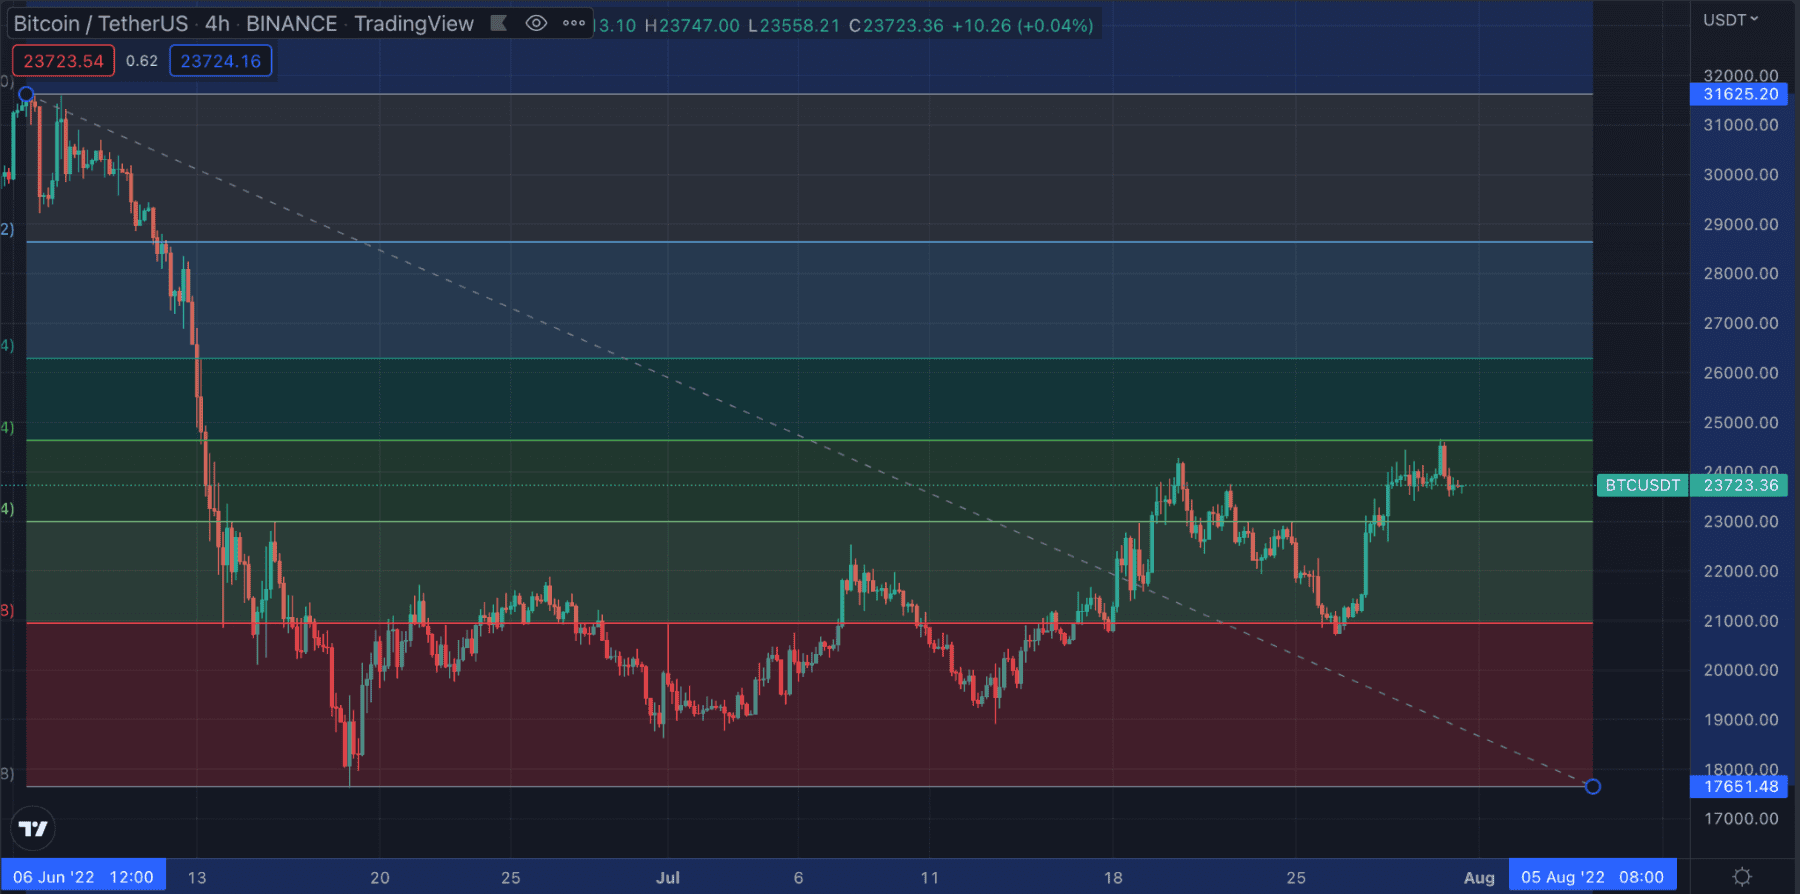
Finally, we have many times heard of how Fibonacci retracement and extension levels work for technical analysts. These retracement or extension levels indicate in the market possible support and resistance levels in specific price ranges.
In order to draw these Fibonacci lines, you should find the most recent bottom and the most recent high. Different charting tools will automatically draw these charts for you, making it quite easy for you to find these Bitcoin support and resistance levels.
As mentioned before, it is very important to use many different indicators to get even better accuracy when analysing the market. Failing to do so could end up creating a situation in which you do have not the necessary information to trade Bitcoin or other digital currencies.
There are many other ways in which you can get information about Bitcoin support and resistance levels. It is up to you to decide how to do it, how you find them, and which investment decision you make out of them.


