
Bitcoin is holding near $84,000 after pulling back from a weekly high above $87,000, leaving the market caught between strong quarterly momentum and a tightening short-term range.
BTC has gained about 43.5% in Q3, rising from roughly $58,500 at the start of July to around $84,000, putting Bitcoin on track for its second-best third quarter on record, behind only 2017.
The immediate setup is narrower, as Bitcoin is trading around a cluster of short-term pivots near $83,900 to $84,200, while resistance sits around $85,000 and then $87,000.
A break above the current compression zone would reopen the recent highs, while a loss of roughly $83,800 would increase the risk of a deeper pullback toward $81,000.
Bitcoin Holds Near $84K After Weekly Pullback
Bitcoin reached approximately $87,363 earlier in the week before correcting about 4% toward $84,000. The decline has not yet broken the broader uptrend, with price still holding above its main daily moving averages.
BTC is currently trading above $84,000 with immediate support around $83,842. Lower timeframes are clustering around similar levels, creating a narrow decision zone around $84,000.
| Level | Role |
| ~$81,400 | 20-day EMA / deeper support |
| $83,800-$84,000 | Immediate support and pivot zone |
| $85,000-$85,800 | Main short-term resistance |
| ~$87,200-$87,400 | Recent weekly high/upper resistance |
| ~$90,000-$91,000 | Higher supply zone |
Table 1. Bitcoin Key Support and Resistance Levels
Bitcoin does not need an immediate breakout to preserve the trend. Holding above the $81,000 to $84,000 area would keep the broader structure intact while price consolidates after the recent rally.
Volatility Is Compressing Around $84K
On the hourly chart, Bollinger Bands have narrowed to roughly $83,800 on the lower side and $84,500 on the upper side.
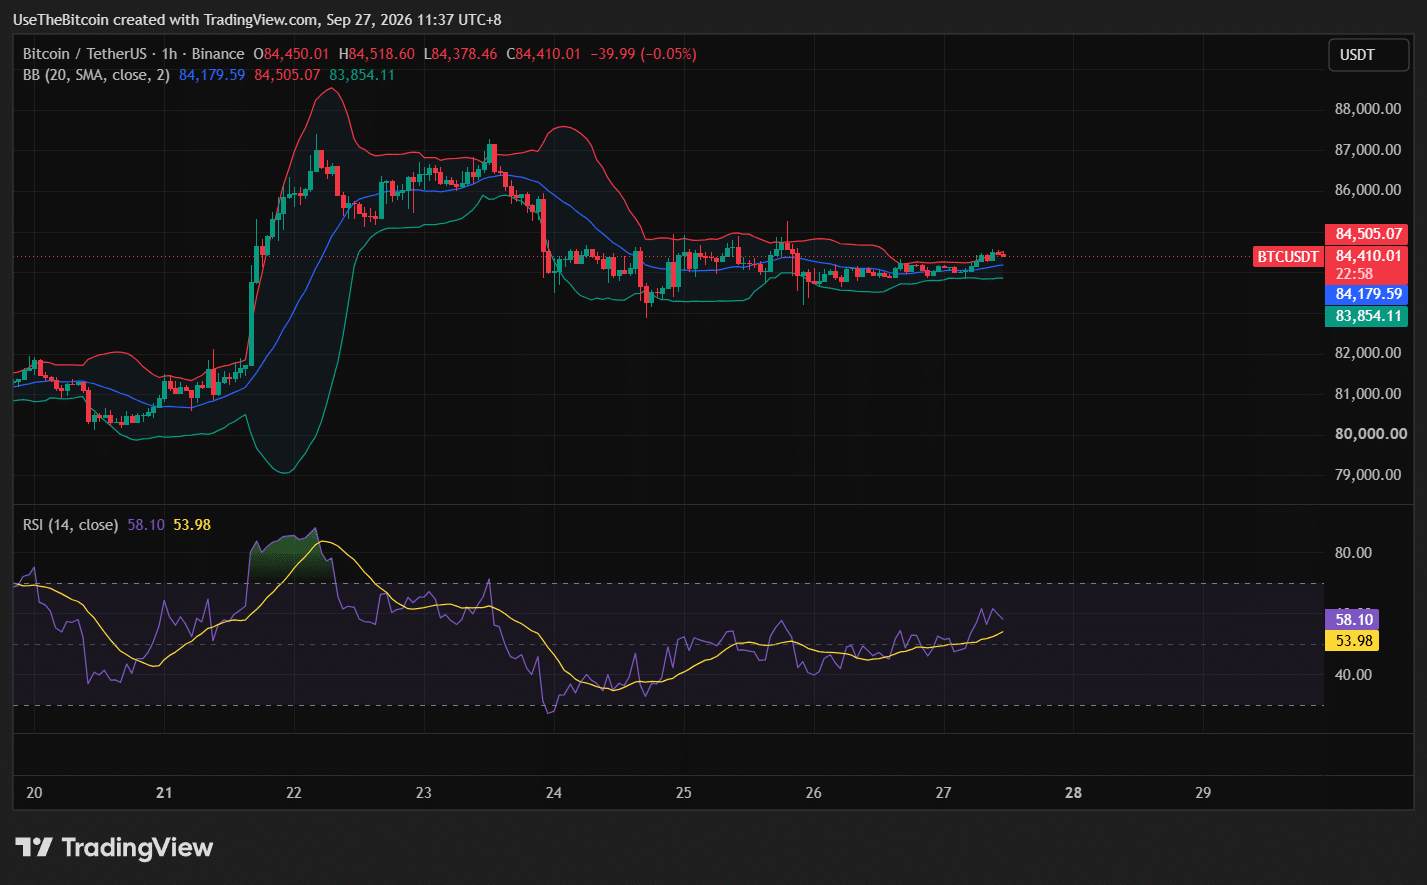
That compression doesn’t predict direction; it shows Bitcoin trading in a much tighter range after a strong move, which often precedes a larger expansion once either support or resistance gives way.
On the daily timeframe, the upper Bollinger Band sits near $87,776, while the lower band is around $73,125, showing that the broader trend remains volatile even as short-term price action has slowed.
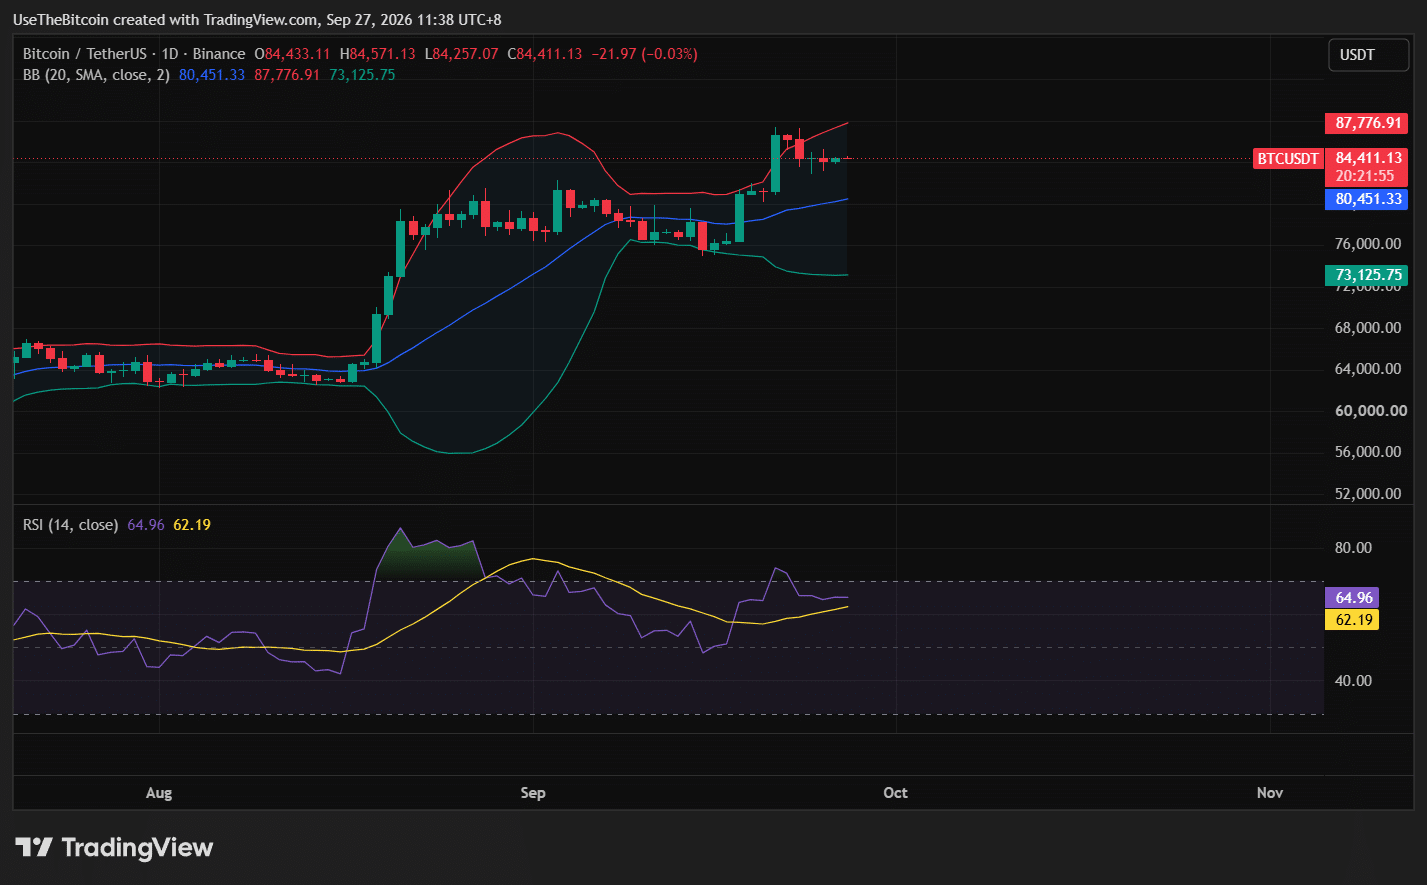
For the current setup, a clean move above roughly $84,200 would be the first sign that buyers are taking control again. A break below $83,800 would shift attention toward the daily 20-day EMA near $81,400.
The Daily Trend Remains Above Major Moving Averages
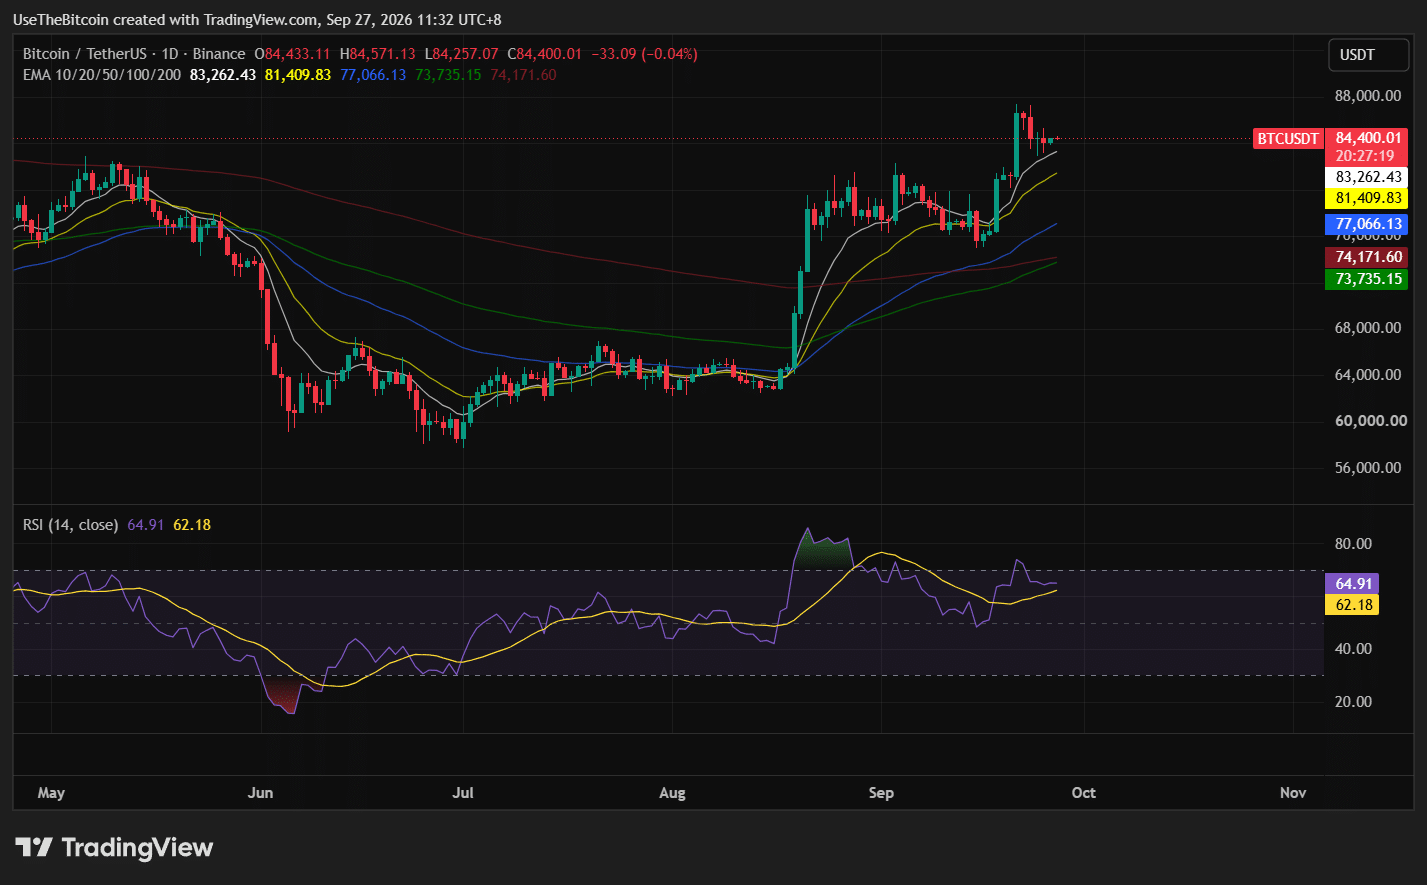
As of September 26, the 20-day EMA stood near $81,400, the 50-day EMA around $77,000 and the 200-day EMA close to $74,100, keeping the moving-average structure aligned positively.
The price is also above the short-, medium- and long-term averages, while the shorter averages remain above the longer ones.
The current consolidation would become more technically important if BTC starts losing the 20-day EMA. Until then, the pullback from $87,000 remains inside the broader recovery structure.
Momentum Is Positive Without Being Overheated
Bitcoin’s daily relative strength index (RSI) is around 64.06.
That is elevated enough to reflect strong demand but still below the extreme readings associated with heavily overbought conditions.
The daily moving average convergence divergence (MACD) also remains positive, with the MACD line above its signal line.
Shorter timeframes are less decisive.
The hourly RSI is near 50, showing little directional bias, while the 15-minute RSI is around 57.6. That combination fits the current consolidation: the larger trend is still positive, but short-term momentum has paused.
The next breakout will carry more weight if momentum starts expanding in the same direction rather than price moving alone.
ETF Demand Remains Strong
US spot Bitcoin exchange-traded funds (ETFs) provided one of the strongest sources of demand during the latest rally.
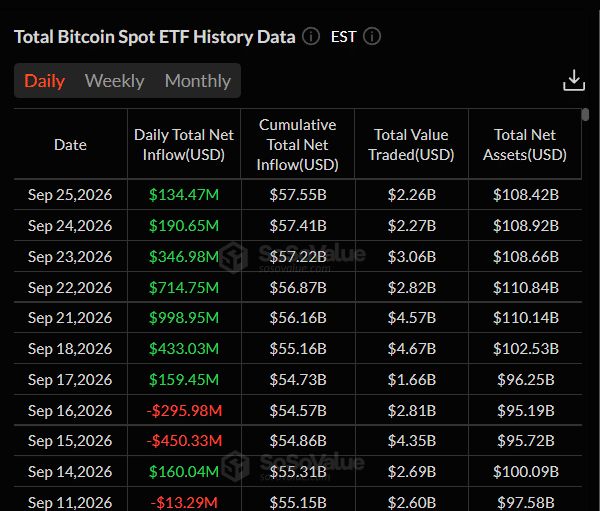
From September 21 through September 25, spot Bitcoin ETFs attracted approximately $2.39 billion in net inflows. Monday alone accounted for about $999 million, the largest daily total of 2026.
The important point is that ETF inflows remained positive even as Bitcoin failed to hold above $87,000, suggesting institutional demand has been strong enough to support the rally, but not yet strong enough to fully absorb the supply appearing around $85,000 and above.
If inflows remain strong while BTC breaks above $85,800, the move would have stronger confirmation than a price breakout occurring with weaker fund demand.
Bitcoin Is on Track for Its Second-Best Q3
Notably, BTC is up about 43.5% in Q3 2026, compared with roughly 80.4% during Q3 2017, which remains the stronger historical quarter, according to CoinGlass data.
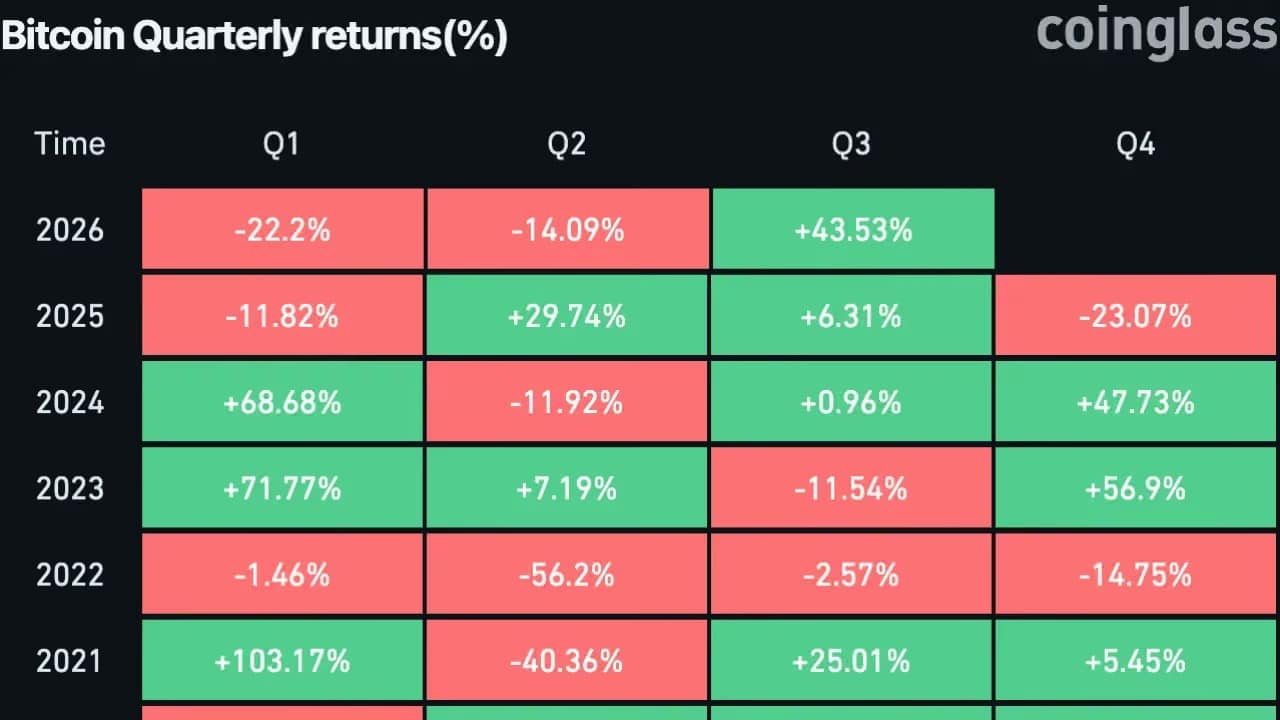
The gain is unusual because Q3 has often been less consistent for Bitcoin than Q4.
This year’s rally has been supported by stronger ETF demand, rising spot activity and relatively restrained profit-taking, but that does not guarantee a stronger fourth quarter.
But it does mean Bitcoin is entering the final days of September from a much stronger price base than it had at the start of July.
Profit-Taking Remains Relatively Contained
Despite the scale of the quarterly rally, onchain data suggests profit-taking has not yet reached the levels seen around previous major market peaks.
Bitcoin has also moved back above several investor cost-basis levels that capped earlier recovery attempts, helping explain why price has held near $84,000 after such a large quarterly gain.
The next major onchain resistance area identified in the supplied analysis is around the mean market value to realized value (MVRV) price near $96,700, and that level is still well above the current market.
BTC would first need to clear $85,000 to $87,000, and then the broader $90,000 to $91,000 supply zone before the $96,700 level becomes a more immediate technical concern.
Q4 Starts With Strong Momentum, but $84K Must Resolve First
Bitcoin is approaching the start of Q4 with one of its strongest Q3 performances on record, but the immediate technical setup remains compressed.
The market has strong ETF inflows, positive daily momentum and a bullish moving-average structure.
At the same time, BTC is sitting just below a concentrated sell zone starting around $85,000, while lower-timeframe volatility has tightened sharply.
That makes the current $83,800 to $85,800 range more important than the larger Q4 narrative in the very short term.
| Scenario | Price Trigger | Possible Outcome |
| Bullish Case | BTC clears $85.8K and retakes $87K | 90K-91K becomes the next major resistance zone |
| Base Case | BTC remains between $81K and $85.8K | Consolidation continues while volatility resets |
| Bearish Case | BTC closes below $81K | 76K-77K becomes the next major support area |
Table 2. Bitcoin Price Scenarios Around the $84K Pivot
Bottom Line
Bitcoin’s volatility has compressed around $84,000, with immediate support near $83,800. Beyond that, $85,000 to $85,800 remains the first major supply zone.
ETF demand remains supportive, with roughly $2.39 billion in net inflows during the latest five-session stretch, but Bitcoin still needs to absorb the sell orders sitting above the current price before the rally can extend.
This article is for informational purposes only and does not constitute financial advice. Crypto price predictions are based on analyst estimates and are not guarantees of future performance. Do your own research before making any investment decisions.
Frequently Asked Questions
Need a refresher? Here are some common questions about Bitcoin’s current price setup.
Why Is Bitcoin Stuck Around $84,000?
Bitcoin is trading inside a narrow short-term range after pulling back from above $87,000. Lower-timeframe volatility has compressed into a range of $83,900 to $84,400, while larger sell orders sit above the market around $85,000 to $85,800.
What Is Bitcoin’s Most Important Support Level?
Immediate support sits around $83,800, but the more important level is the 20-day EMA near $81,400. A sustained break below $81,000 would weaken the current short-term trend.
What Price Does Bitcoin Need to Break?
The first important resistance zone is $85,000 to $85,800. A sustained move above that range would put the recent high near $87,363 back into focus.
Are Bitcoin ETF Inflows Still Strong?
Yes. US spot Bitcoin ETFs recorded approximately $2.39 billion in net inflows from September 21 through September 25, with inflows reported across all five sessions.
How Strong Has Bitcoin Been in Q3 2026?
Bitcoin has gained roughly 43.5% during the third quarter, putting it on track for its second-best Q3 on record behind 2017.