
Ethereum is holding near $2,700 after another rejection from the $2,750 to $2,820 resistance zone, leaving ETH in a constructive but unresolved setup heading into the final days of September.
The broader structure remains stronger than it was earlier this month, as Ethereum broke above the $2,530 to $2,540 area and later pushed above $2,700, but repeated attempts to close above $2,800 have failed.
A sustained break above $2,800 would bring $3,000 to $3,050 into play, while a deeper pullback toward $2,530 to $2,540 would test whether the September breakout can hold as support.
Ethereum Consolidates Below $2.8K
Ethereum has tested the $2,800 area several times without securing a convincing daily close above it.
The latest rally reached roughly $2,804 before price slipped back into the upper $2,600s. Ethereum’s main rejection zone is between approximately $2,750 and $2,820, where sellers have repeatedly slowed the advance.
| Level | Role |
| $2,530-$2,540 | Major breakout-retest support |
| $-2,600-$2,660 | Near-term support |
| ~$2,680-$2,700 | Current price area |
| $2,750-$2,825 | Main resistance zone |
| ~$3,000 | Psychological resistance |
| ~$3,050 | Next technical upside level |
| ~$3,200 | Higher resistance if $3K breaks |
Table 1. Ethereum Key Support and Resistance Levels
ETH remains above the former $2,530 to $2,540 resistance zone, so the larger September breakout remains valid. The problem is that buyers have yet to turn $2,800 into support as we head into October.
Daily Structure Still Shows Higher Lows
Ethereum’s larger chart remains constructive despite the rejection near $2,800. After the August rebound from the $1,850 to $1,920 demand area, ETH has continued to form higher lows while an ascending trendline remains intact.
ETH can consolidate below resistance without breaking the broader recovery as long as successive pullbacks hold above key support.
The setup would weaken if price starts losing the higher-low structure and falls through the former breakout zone near $2,530.
Moving Averages Are Approaching a Bullish Crossover
The daily chart is also approaching a potentially important moving-average crossover. Technical analysis shows Ethereum’s major daily moving averages converging after the sharp recovery from August lows.
A bullish crossover can confirm improved medium-term momentum, but it is a lagging indicator. It reflects price action that has already occurred rather than guaranteeing another immediate rally.
A crossover accompanied by a sustained break above $2,800 would carry more weight than a crossover while Ethereum remains trapped below resistance.
ETF Inflows Continue to Support Demand
US spot Ethereum exchange-traded funds (ETFs) remain a supportive part of the current setup.

Recent data from SoSoValue showed approximately $66 million in daily net inflows, with total assets across US spot Ethereum ETFs near $17.7 billion.
The September 24 snapshot recorded roughly $131.2 million in daily ETH ETF inflows and about $563.2 million over seven days, showing that institutional demand has remained positive even as ETH struggles below $2,800.
ETF demand does not guarantee a breakout, but continued inflows could help absorb supply if Ethereum tries again to break into the resistance zone.
Rising Treasury Yields Add Macro Pressure
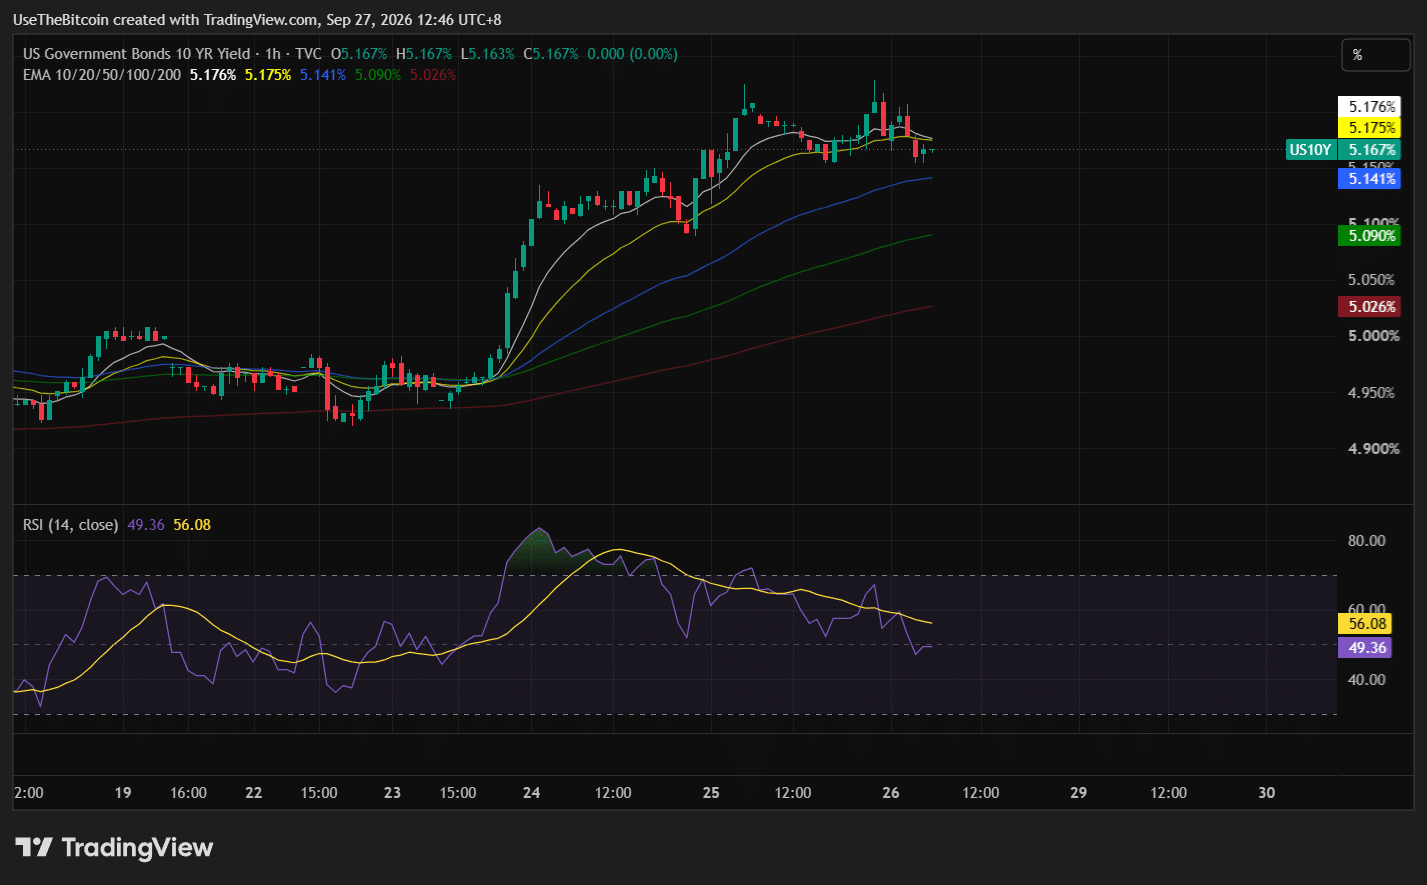
The US 10-year Treasury yield rose to approximately 5.11% on September 25 as stronger economic data pushed bond yields higher. ETH traded near $2,678 during the session while Bitcoin also weakened.
Higher Treasury yields can reduce demand for risk assets because investors can earn more from lower-risk government debt, creating a macro headwind for Ethereum even as ETF demand and the technical structure remain supportive.
If yields continue rising, ETH may need stronger spot demand to break through $2,800.
$3K Comes Into Focus Only After $2.8K Breaks
Ethereum’s path toward $3,000 is straightforward technically, but several steps remain.
ETH first needs to reclaim the upper $2,700s and close above the $2,775 to $2,825 resistance levels. Only then does $3,000 become the next major psychological level.
Beyond that, technical projections extend toward approximately $3,050, while other analysis places a broader resistance area around $3,000 to $3,200.
ETH Still Needs Confirmation Above Resistance
Ethereum’s short-term setup is therefore less about whether it can touch $2,800 again and more about whether it can remain above it.
Repeated tests without a daily close show that supply remains active in the $2,750 to $2,825 area. Meanwhile, support around $2,600 to $2,660 and the larger $2,530 to $2,540 breakout zone continue to protect the recovery.
The next decisive move will come when one of those boundaries breaks.
| Scenario | Price Trigger | Possible Outcome |
| Bullish Case | ETH closes above $2.80K | $3,000 becomes the next resistance zone |
| Base Case | ETH holds $2.53K-$2.60K but remains below $2.80K | Consolidation continues while the September breakout is retested |
| Bearish Case | ETH closes below $2.53K | The breakout weakens, and lower support comes back into focus |
Table 2. Ethereum Price Scenarios Below $2.8K Resistance
Bottom Line
Ethereum is holding around $2,700 after another rejection from the $2,750 to $2,820 resistance zone.
The broader structure remains constructive, as the second-largest cryptocurrency by market cap has maintained a sequence of higher lows following the August recovery, sits above its former $2,530 to $2,540 breakout area, and continues to receive support from US spot ETF inflows.
The immediate challenge is $2,800. A sustained daily close above that level would strengthen the breakout and shift attention toward $3,000. Continued rejection would leave $2,600 to $2,660 as the first support area and $2,530 to $2,540 as the more important test.
Rising US Treasury yields add a macro headwind, so ETH will need continued spot demand to overcome the resistance that has repeatedly capped the September rally.
This article is for informational purposes only and does not constitute financial advice. Crypto price predictions are based on analyst estimates and are not guarantees of future performance. Do your own research before making any investment decisions.
Frequently Asked Questions
Need a refresher? Here are some common questions about Ethereum’s current price setup.
Why Is Ethereum Struggling at $2,800?
Ethereum has tested the $2,775 to $2,825 area several times without establishing a convincing daily close above it. That concentration of selling pressure has turned $2,800 into the main short-term resistance level.
What Is Ethereum’s Most Important Support Level?
Immediate support sits around $2,600 to $2,660, but the larger breakout support is $2,530 to $2,540. That area acted as resistance before Ethereum’s September advance and is now the key level buyers would want to defend during a deeper pullback.
What Happens if Ethereum Breaks Above $2,800?
A sustained close above $2,800 would clear the current resistance cluster and bring $3,000 into focus. Technical projections then place the next upside level around $3,050.
Are Ethereum ETF Inflows Still Positive?
Recent data showed positive US spot Ethereum ETF flows, including about $66 million in daily net inflows in one September 26 snapshot. Another September 24 reading showed approximately $131.2 million of daily inflows.
Why Do Treasury Yields Matter for Ethereum?
Higher Treasury yields make government bonds more attractive relative to risk assets. The US 10-year yield reached about 5.11% on September 25, contributing to broader pressure across crypto markets, including Ethereum.