
XRP traded between $1.07 and $1.09 on Monday, July 13, 2026, after slipping to a roughly 10-day low amid renewed US-Iran military tensions, then later recovered to test resistance near $1.11 to $1.12 on shorter-term charts.
What Happened To XRP This Week
XRP fell to $1.01 earlier this month during a market-wide crash, its lowest level in nearly two years, then rebounded to challenge $1.20 before being rejected and sliding back under $1.10.
The token spent the following week trading sideways between $1.09 and $1.12, until that support gave way on Monday morning as markets priced in new US-Iran strikes, pushing XRP to just under $1.07. XRP is down 1.39% over 24 hours, with active addresses on the XRP Ledger falling to 25,350 on July 11, the network’s second-lowest daily reading of 2026, and new wallet creation dropping to 2,130, its lowest level since November 2024.
Institutional flows added to the pressure. US spot XRP ETFs recorded $7.29 million in net outflows on July 8, ending a nine-week inflow streak and pushing total ETF assets below $1 billion.
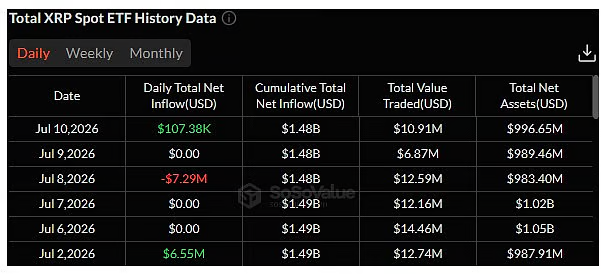
However, spot XRP ETFs still accumulated $1.4 to $1.5 billion in net inflows over the trailing month, according to SoSoValue data, meaning the single-week outflow marked a pause in an otherwise strongly positive monthly trend rather than a reversal.
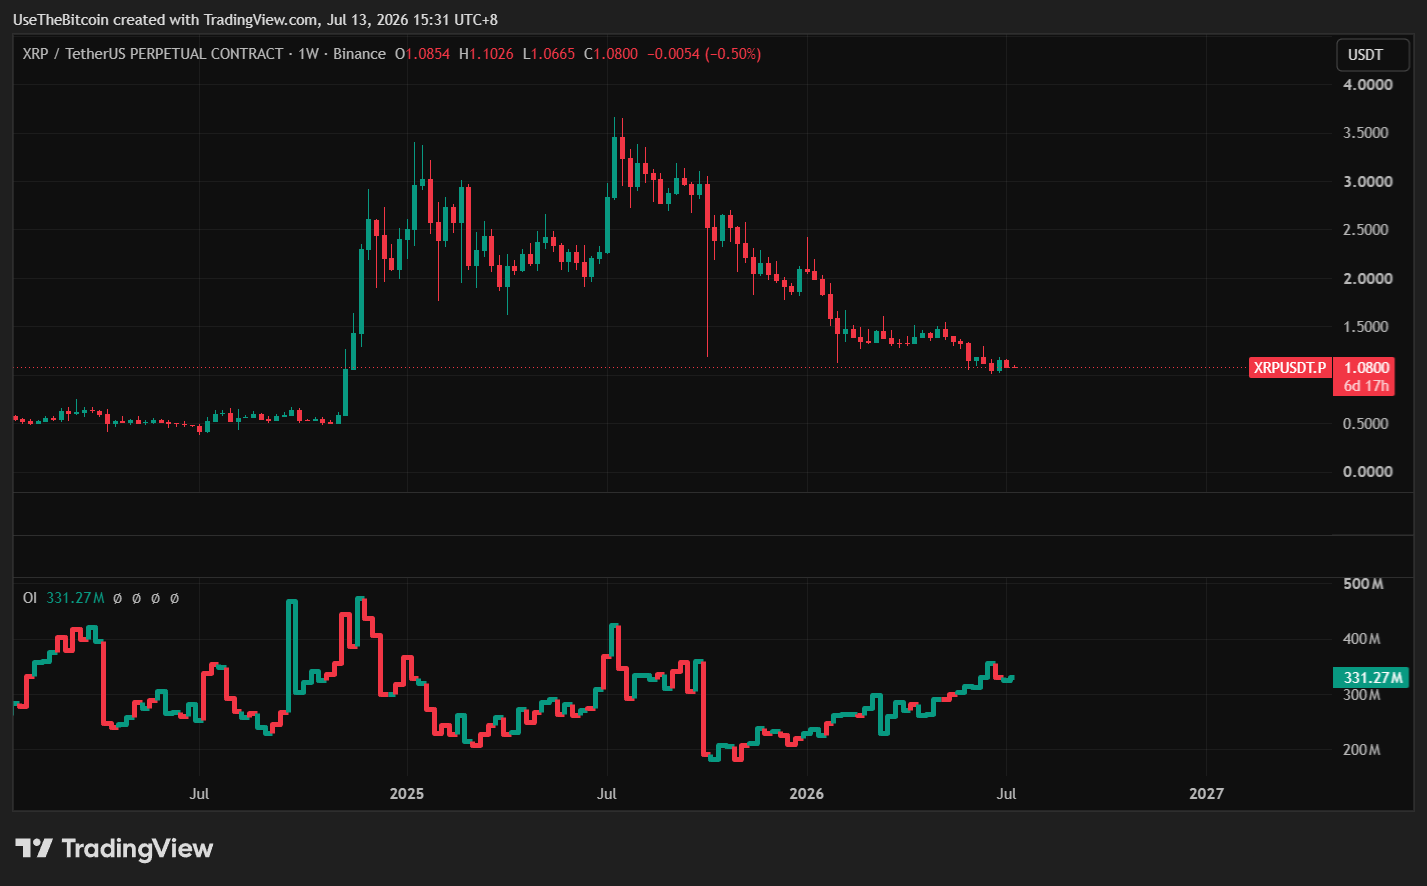
Binance XRP futures open interest fell to about 397 million XRP, its lowest level in more than three months, with total open interest dropping from $1.32 billion to $764.57 million.
| Level | Role | Notes |
| $0.80 | Deeper support | Only relevant if $1.00 fails to hold |
| $1.00-$1.02 | Psychological support zone | Exposed on a break below $1.07 |
| $1.07 | Immediate support | 50-period EMA on the 4h chart |
| $1.09–$1.12 | Prior consolidation range | Recent sideways trading band |
| $1.1170 | Current resistance | Descending trendline intersects prior swing high |
| $1.1654–$1.2140 | Upside targets | Reachable on a confirmed break above $1.1170 |
| $1.22–$1.28 | Channel resistance | Reachable only above a $1.15 daily close, per Analytics Insight |
| $1.40–$1.60 | Structural resistance | Needed to change the broader descending channel |
Historical Context
XRP’s current setup is forming a descending channel that began after XRP’s July 2025 peak near $3.65, meaning the token has spent roughly a year losing ground within a well-defined downtrend rather than in a fresh, unprecedented slide.
Within that broader channel, whale positioning has diverged by wallet size, with wallets holding between 10 million and 100 million XRP having accumulated throughout the year, while wallets holding between 100,000 and 10 million XRP have reduced their balances over the same period.
Separately, Santiment and analyst Ali Martinez noted on X that large transactions worth over $1 million on the XRP Ledger dropped from 70 to just 2 in about a week.
What Are Analysts on X Saying About XRP?
CRYPTOWZRD described XRP’s latest close as “indecisive” and told followers on X that further upside is likely if XRP can gain traction against Bitcoin, something it has struggled to do for some time.
EGRAG CRYPTO remains bullish on a longer horizon, arguing on X that the macro bottom may already be in and that XRP needs a bounce toward the 50-week moving average near $1.60, a healthy rejection, and a retest of the 0.618 Fibonacci zone to complete what he calls a double-bottom setup. His stated targets range widely, from $5 to $6.50 on the conservative end, up to $31 in what he frames as an extreme scenario.
A more informal but widely shared view came from Cryptoinsightuk, who expects XRP to attempt to reclaim the $1.12 level, but the more likely short-term outcome is a liquidity sweep lower before any sustained move higher. His posted chart shows the expected path is a dip toward the $0.90-$1.00 area, followed by a sharp recovery toward the $1.40 region by late summer.
For an extended look at how various analysts approach longer-term XRP targets, our XRP price prediction guide covers a wider range of scenarios beyond this week’s setup.
XRP Technical Analysis Outlook
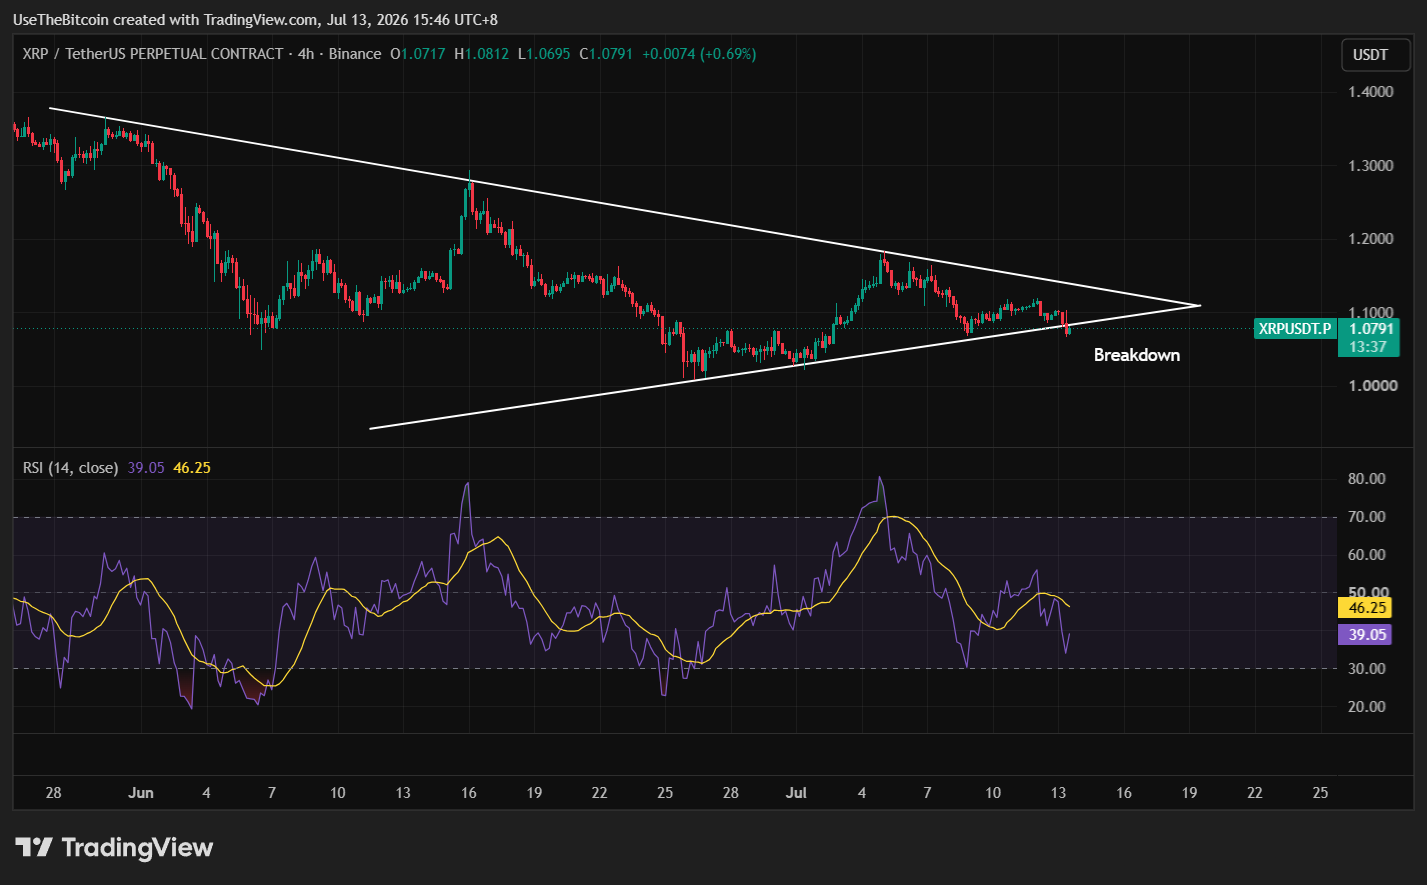
The 4-hour chart shows XRP’s most recent candle closing at $1.1032, with a high of $1.1838 on July 5. The 14-period RSI is sitting at 39, near the oversold territory.
The price has broken down from the symmetrical triangle structure and is currently retesting the trendline. Failure to reclaim inside the structure (old support turned into resistance) could affect XRP’s price in the coming days.
What to Watch Next for XRP?
The CLARITY Act, the US digital asset market structure bill that cleared the Senate Banking Committee, was expected to reach a full Senate vote in July but has since been pushed to August.
A vote in either direction would likely move XRP, given the bill’s potential to classify XRP as a digital commodity in most markets. Beyond that, traders are watching whether ETF flows return to net inflows after last week’s outflow, whether whale transaction counts recover from their recent cooldown, and whether XRP can close above $1.1170 to open a path toward $1.1654 and beyond, or instead loses the $1.07 support and exposes the $1.00 to $1.02 zone.
Frequently Asked Questions
Need a refresher? Here are the questions traders are asking about XRP this week.
Why is XRP facing resistance near $1.12?
XRP is testing a descending trendline on the 4-hour chart that has capped the price since a swing high above $1.50 in June. That trendline currently intersects a prior swing high around $1.1170, making it the level bulls need to clear before a move toward $1.1654 and $1.2140 becomes likely.
Did XRP ETFs see inflows or outflows this week?
Both, depending on the window. US spot XRP ETFs recorded $7.29 million in net outflows on July 8, ending a nine-week inflow streak. Over the trailing month, though, those same ETFs still accumulated $1.4 to $1.5 billion in net inflows, meaning the single-week outflow was a pause within a broader positive trend rather than a reversal.
Why did XRP whale activity drop so sharply?
Santiment and analyst Ali Martinez noted that large XRP Ledger transactions worth over $1 million fell from 70 to just 2 in about a week. Active addresses on the network also dropped to 25,350 on July 11, the network’s second-lowest daily reading of 2026, and new wallet creation fell to its lowest level since November 2024.
What happens if XRP breaks below $1.07?
A break below the $1.07 support, as the 50-period EMA on the 4-hour chart, would expose the $1.00 to $1.02 psychological zone. Meaning the deeper weakness beyond that could bring the $0.80 level back into focus.
How does the CLARITY Act affect XRP’s price outlook?
The CLARITY Act is a US bill to establish rules for the digital asset market structure, and its passage could result in XRP being treated as a digital commodity in most markets. The bill cleared the Senate Banking Committee, but the full Senate vote has been delayed from July to August, and that delay has weighed on near-term sentiment even as some analysts still consider it XRP’s biggest long-term bullish catalyst.