
Bitcoin traded near $63,500 to $63,800 this week, rebounding slightly after four consecutive days of losses but still unable to clear $65,000, a ceiling that’s capped every rally attempt so far this month.
Institutional Flows Stayed Cautious, and Whales Kept Selling
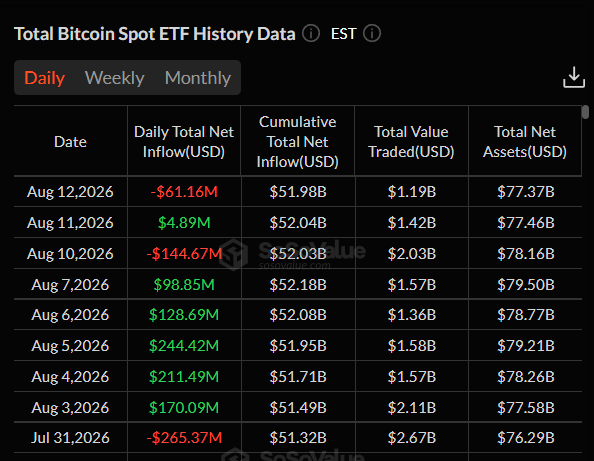
US-listed spot Bitcoin ETFs recorded a $61.16 million outflow on Wednesday, according to SoSoValue data, following a mild inflow Tuesday and an outflow Monday, a mixed pattern suggesting institutional investors remain hesitant to add exposure amid ongoing uncertainty.
Separately, on-chain tracker Lookonchain identified a wallet tied to Paxos offloading another 800 BTC, worth roughly $50.72 million, through market maker Wintermute.
That same wallet has now sold 2,500 BTC over two months, totaling close to $154 million.
Analyst Ted Pillows flagged that Bitcoin could not hold above $65,000 even as stocks and metals climbed the same week, describing momentum as fading and pointing to $60,500 to $61,000 as the next likely test zone if current support gives way.
The Macro Backdrop Behind the Range
July’s US Consumer Price Index (CPI) eased to 3.4% year over year from 3.5% in June, in line with expectations, while core CPI matched consensus at 0.2% month over month and 2.5% annually.
Combined with a weaker-than-expected Nonfarm Payrolls report the prior Friday, that data gives the Federal Reserve more room to hold rates steady at its September meeting, which would typically support risk assets like Bitcoin.
That initial positive reaction faded quickly as attention shifted to oil. West Texas Intermediate crude rose more than 5.5% this week while Bitcoin fell 1.82% over the same stretch, and sustained higher energy costs could make it harder for inflation to keep easing, limiting the case for Fed rate cuts.
Ongoing uncertainty around a potential US-Iran peace deal, alongside escalating Houthi attacks on vessels near the Red Sea and Bab el-Mandeb Strait, has raised war-risk premiums and stoked concern about energy supply disruptions.
What’s Pinning Bitcoin in This Range
The clearest explanation for why Bitcoin keeps failing to break out comes from cost-basis data.
Glassnode’s latest research highlights that Bitcoin’s short-term holders, those who bought within the past six months, are sitting roughly 7.2% underwater on their positions in aggregate, with their average entry price, or realized price, calculated at $68,700.
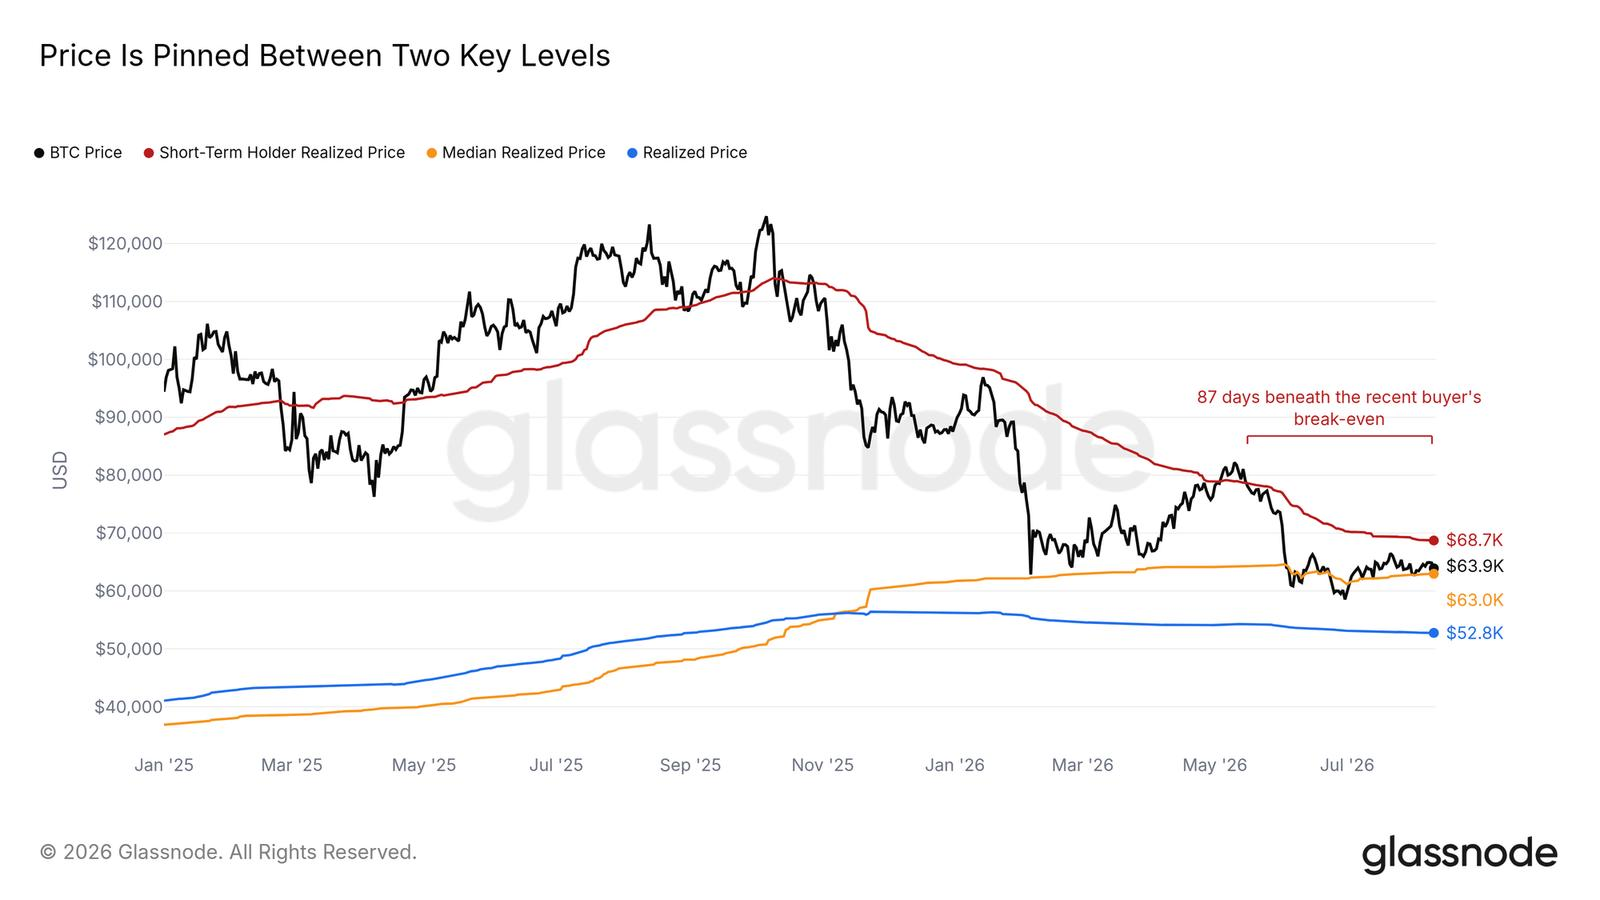
That level now functions as a key resistance, since holders sitting on a loss tend to sell into any recovery that brings them back toward breakeven.
“The cost-basis ladder frames the stalemate,” Glassnode wrote. “Spot sits just above the Median Realized Price at $63.0K, the level that splits every coin’s cost basis down the middle, and below the Short-Term Holder Cost Basis at $68.7K, the average entry of the market’s most recent buyers. That cohort is underwater, which historically makes it quick to sell into recoveries, while the median level has absorbed every test from above for more than a month.”
Bitfinex Alpha’s research adds a supply-based explanation for why this specific range has proven so difficult to break.
According to UTXO Realized Price Distribution data, the $62,000 to $65,000 band alone holds 1,794,308 BTC, about 8.93% of the entire circulating supply, with the heaviest concentration sitting near $63,800.
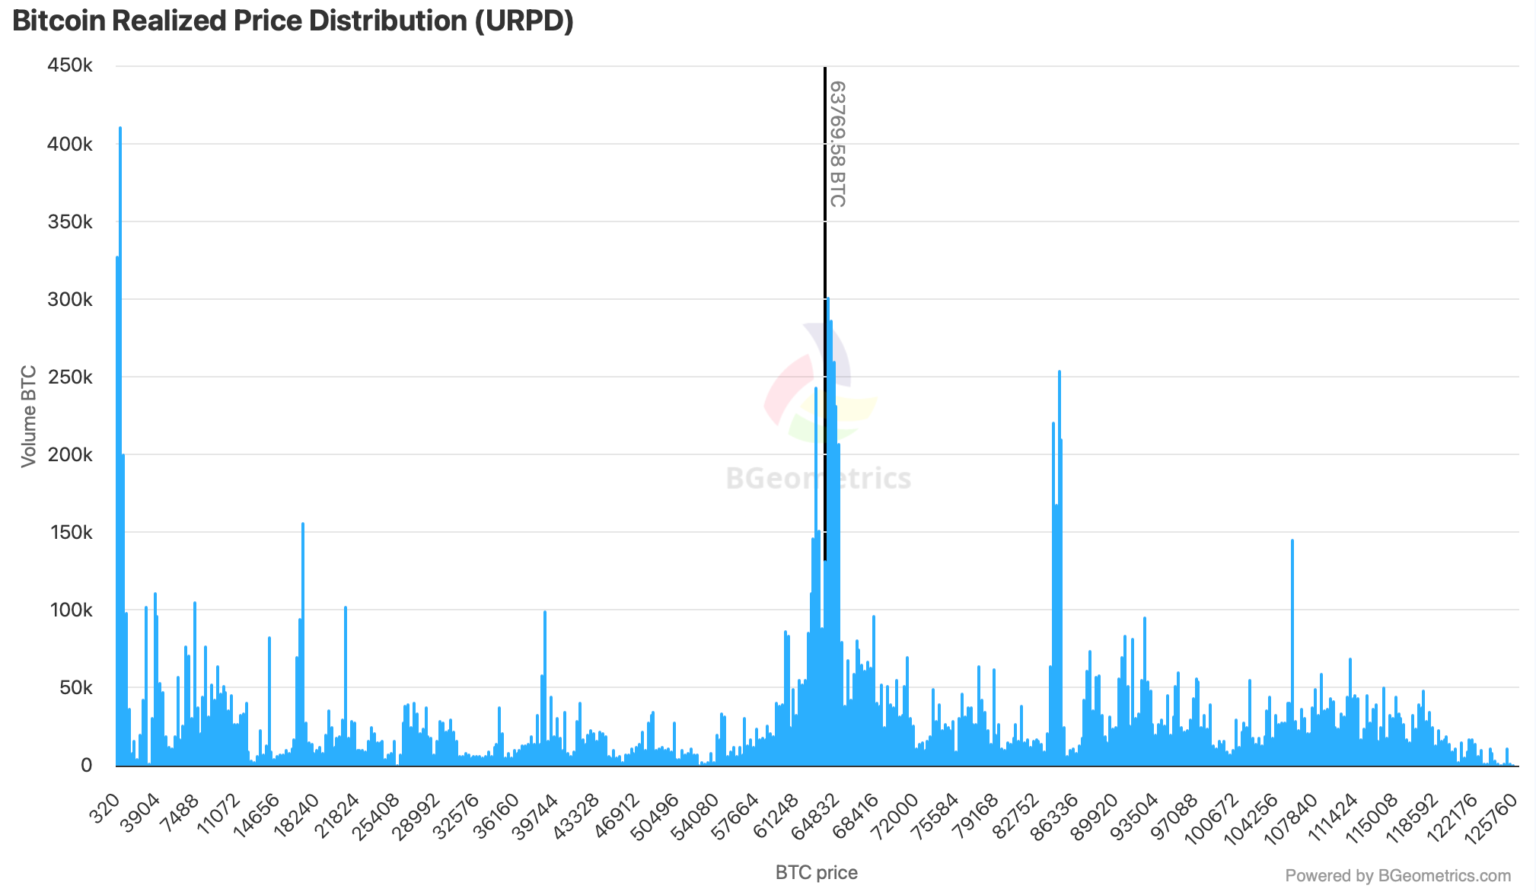
“The reason the boundaries are so stubborn is due to ownership,” Bitfinex Alpha wrote. “With price trading inside this band, the largest concentration of holders across any narrow $3,000 range keeps moving between profit and loss and a large volume of coins changes hands as a result.”
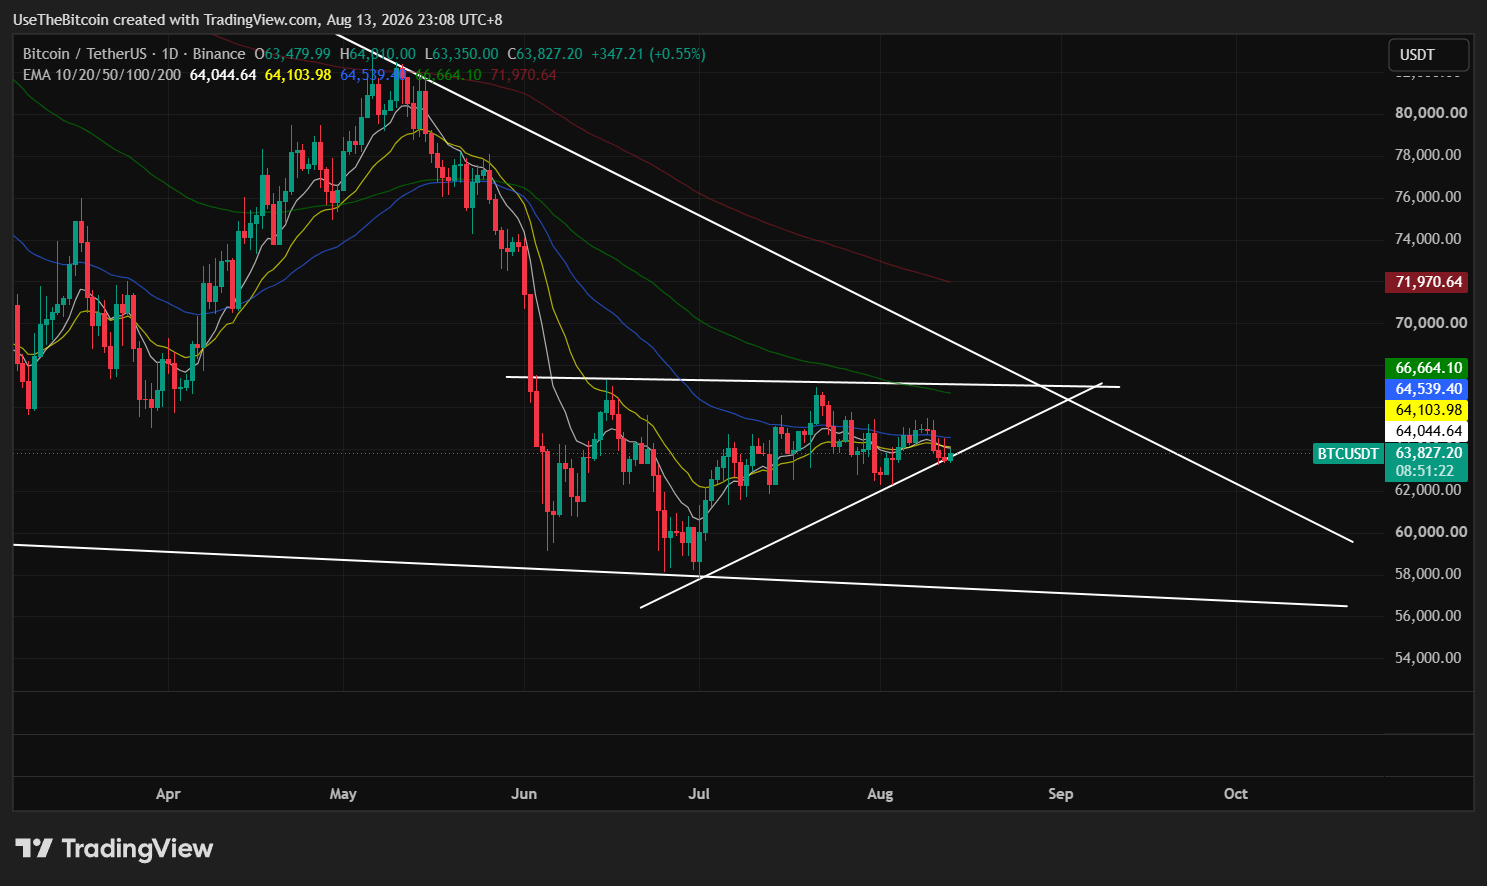
Bitcoin has been wedged between roughly $58,000 and $68,000 since the start of June, with a separate 50-month trendline near $65,800 further constricting price within that broader range.
Trader Rekt Capital has separately warned that $63,000 is weakening as local support, with each rebound from that level gaining progressively less ground than the last.
| Level | Role | Notes |
| $57,800 | Yearly low | Set July 1, would come into play on a break below $62,300 |
| $60,500 – $61,000 | Bear case target | Cited by Ted Pillows as the next likely test zone |
| $62,238 – $62,300 | Immediate support | Consistent across sources as the range’s lower boundary |
| $63,000 | Weakening local support | Rekt Capital notes diminishing rebounds from this level |
| $65,000 | Immediate resistance | Ceiling capping every rally attempt this month |
| $65,800 | 50-month trendline | Further constricting the broader range from above |
| $66,500 – $66,667 | 100-day EMA / horizontal resistance | Roughly coincides across sources |
| $68,700 | Short-term holder cost basis | Key resistance per Glassnode, aggregate breakeven point |
| $69,400 | Old all-time high | Set November 2021, sits just above the STH cost basis |
Bottom Line
Bitcoin’s range-bound stretch looks less like indecision and more like a structural standoff between a large, underwater cohort of recent buyers eager to sell into any recovery and a dense concentration of supply sitting right at current spot price.
Layered macro uncertainty, mixed ETF flows, steady whale distribution, and unresolved geopolitical risk around oil are compounding an already stubborn technical setup.
A daily close back above the 50-day EMA, followed by a reclaim of the 100-day EMA near $66,500 to $66,667, remains the clearest signal that this specific stalemate is breaking in the bulls’ favor, while a confirmed break below $62,238 opens the door toward the $60,500 to $61,000 zone several analysts are already watching.
This article is for informational purposes only and does not constitute financial advice. Crypto price predictions are based on analyst estimates and are not guarantees of future performance. Do your own research before making any investment decisions.
Frequently Asked Questions
Need a refresher? Here are the questions traders are asking about Bitcoin this week.
Why can’t Bitcoin break above $65,000?
Bitcoin faces resistance from a dense concentration of supply near the current price, with nearly 9% of circulating BTC trading at a cost basis between $62,000 and $65,000, according to Bitfinex Alpha. Above that, short-term holders who bought in the past six months are sitting underwater at an average cost basis of $68,700, per Glassnode, and tend to sell into any recovery that approaches breakeven.
Who is selling Bitcoin right now?
A wallet tied to Paxos has sold 2,500 BTC over the past two months through market maker Wintermute, worth roughly $154 million total, according to on-chain tracker Lookonchain. This has been a steady, grinding pattern of distribution rather than a single large sale.
What would confirm Bitcoin is breaking out of this range?
A daily close back above the 50-day EMA, followed by a reclaim of the 100-day EMA near $66,500 to $66,667, would be the clearest signal. Given that supply and short-term holder resistance sit below $68,700, clearing that level specifically would mark a more decisive shift.
What’s the bear case for Bitcoin right now?
A confirmed break below $62,238 to $62,300 support would open the door toward $60,500 to $61,000, a zone analyst Ted Pillows has flagged as the next likely test, with the yearly low of $57,800 from July 1 as a further downside level if that zone also fails to hold.
How is the situation in the Middle East affecting Bitcoin’s price?
Uncertainty around a potential US-Iran peace deal and escalating Houthi attacks near key shipping routes have raised war-risk premiums and stoked concern about oil supply disruptions. Rising oil prices complicate the case for easing inflation, which limits expectations for Fed rate cuts and adds a layer of macro caution weighing on Bitcoin alongside its existing technical setup.
Disclosure: The writer holds Bitcoin.