Key Takeaways
- An increase in the Global Liquidity Index (GLI) often correlates with a rise in Bitcoin’s price, suggesting that higher global liquidity supports investment in cryptocurrencies.
- However, correlation does not imply causation. Other factors, such as regulatory developments and market sentiment, also play significant roles.
- GLI serves as a “smoke detector,” alerting to potential market movements, and further analysis is needed to understand the underlying causes.
- In the first half of 2024, the correlation between GLI and Bitcoin’s price weakened, indicating that other factors were becoming more influential.
Can the Global Liquidity Index (GLI) actually predict Bitcoin’s price? This article explores the connections between GLI, Bitcoin Dominance, and Bitcoin’s price, evaluating whether or not GLI is a reliable indicator for understanding Bitcoin’s performance from a macroeconomic perspective.
What Is The Global Liquidity Index (GLI)?
The Global Liquidity Index (GLI) gauges the ease of obtaining credit in global financial markets. It reflects how much money is flowing freely for investment purposes.
This gives the impression that when global liquidity is high, there is greater confidence from traders, investors, governments, and sovereign institutions to put their funds into investments.
Notably, one of the market’s apparent liquidity is the M2 money supply.
M2 Money Supply
The M2 money supply, which translates to the total supply of funds the nation or government has at hand, is also being measured through the Global Liquidity Index.
This also indirectly indicates that if the government plans to print money, the GLI will also increase. This represents the overall availability of liquid assets in global finance, which is influenced by a central bank through interest rates, economic conditions, and market sentiment.
For example, the Federal Reserve cut interest rates by half a percentage point on September 18, 2024. At the same time, it kept shrinking its balance sheet, the opposite of quantitative easing, until December 1, 2025.
Therefore, if more money flows into the economy due to printing, the Global Liquidity Index, the metric representing the total liquid assets on the market, increases. In other words, the GLI indicates that the money flow is growing in the market when the Fed prints more money.
What Does It Mean If GLI Increases?
In short, the institutions are ready to put more liquidity into the markets. This can create lower transaction costs due to the readily available buyers and sellers, as well as tight bid-ask spreads.
Is A Higher GLI An Indication For Bitcoin To Go Higher?
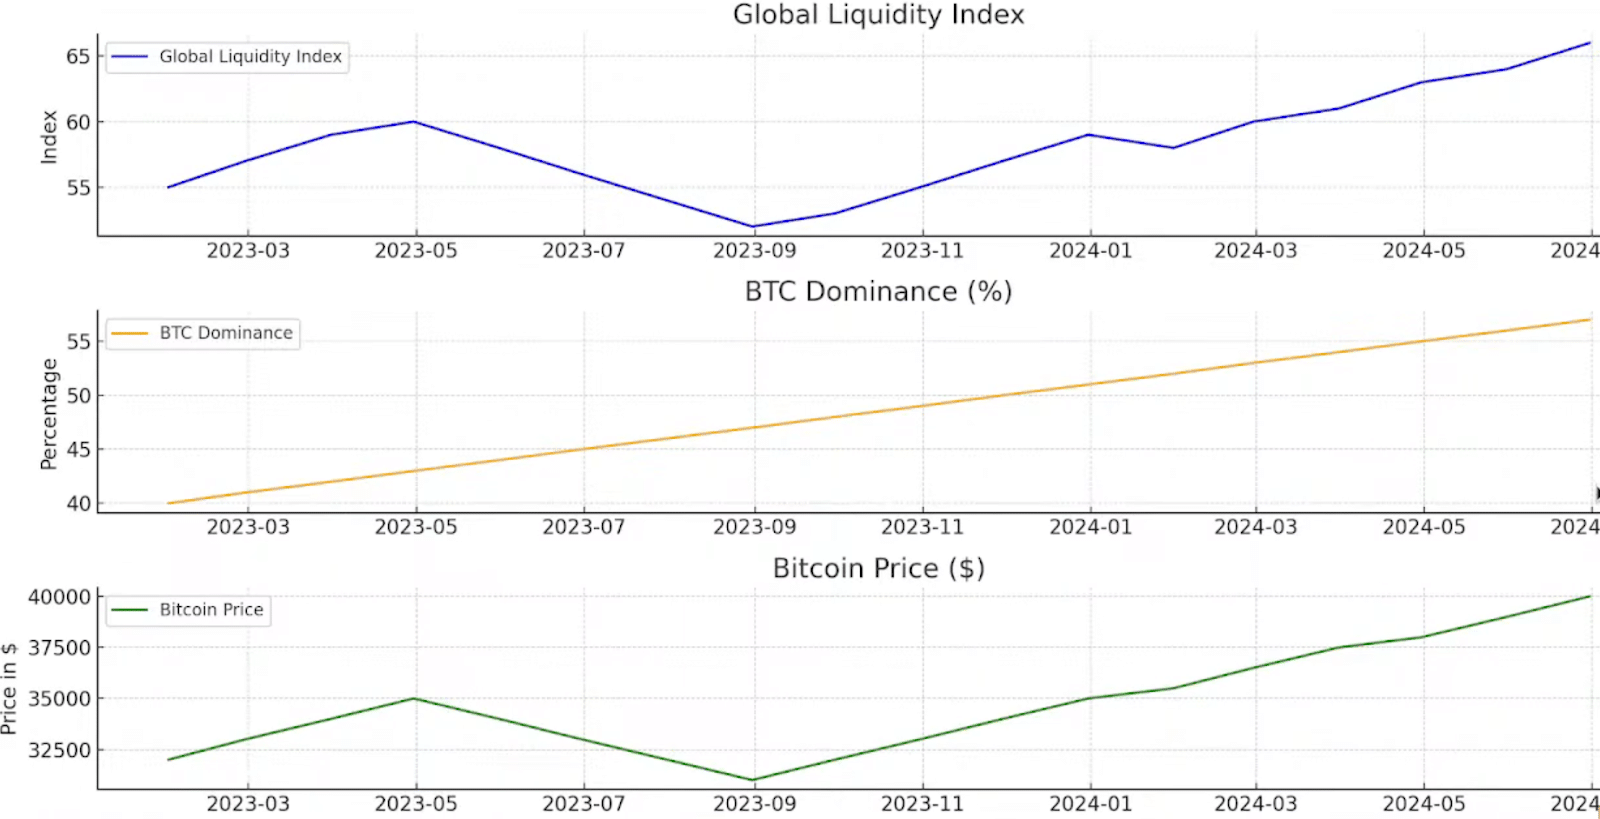
According to data, the Global Liquidity Index is exponentially rising as of March 2023. This means that after a horrible inflation level, central banks were preparing to put more assets in the market.
As you can notice, there’s a correlation between the movement of the GLI and the Bitcoin price.
| Date | Global Liquidity Index | Bitcoin Dominance | Bitcoin Price |
| 2023-01-31 | 55 | 42% | $23,100 |
| 2023-02-28 | 57 | 42% | $23,100 |
| 2023-03-31 | 59 | 46% | $28,500 |
| 2023-04-30 | 60 | 47% | $29,200 |
| 2023-05-31 | 58 | 46% | $27,200 |
| 2023-06-30 | 56 | 50% | $30,500 |
| 2023-07-31 | 54 | 48% | $29,200 |
| 2023-08-31 | 52 | 48% | $25,900 |
| 2023-09-30 | 53 | 49% | $27,000 |
| 2023-10-31 | 55 | 53% | $34,700 |
| 2023-11-30 | 57 | 52% | $37,700 |
| 2023-12-31 | 59 | 50% | $42,300 |
Therefore, when the GLI increases, it often correlates with a rise in the price of Bitcoin, suggesting that increased global liquidity supports high investment in cryptocurrencies.
Here’s The Secret…
Think of the GLI as a smoke detector. It alerts us to a problem, but we need to investigate the source of the smoke.
Developments in mid-2024, such as the European Central Bank (ECB) lowering interest rates on June 6 for the first time in five years and the launch of Bitcoin ETFs in Canada, Australia, Thailand, and Hong Kong, did not spur Bitcoin’s price at the time. So, what does that mean?
In short, the price of Bitcoin is heavily influenced by US economic factors. It can be recalled that when the May 2024 CPI report came with good news on June 12, 2024, Bitcoin rose to as high as $68,000-$69,000. Moreover, when the Federal Open Market Committee (FOMC) meeting later that day turned hawkish, Bitcoin’s price dumped again.
Since Bitcoin appears more sensitive to US economic data, we will focus on the US M2 money supply for our analysis.
US M2 Supply And Bitcoin Correlation
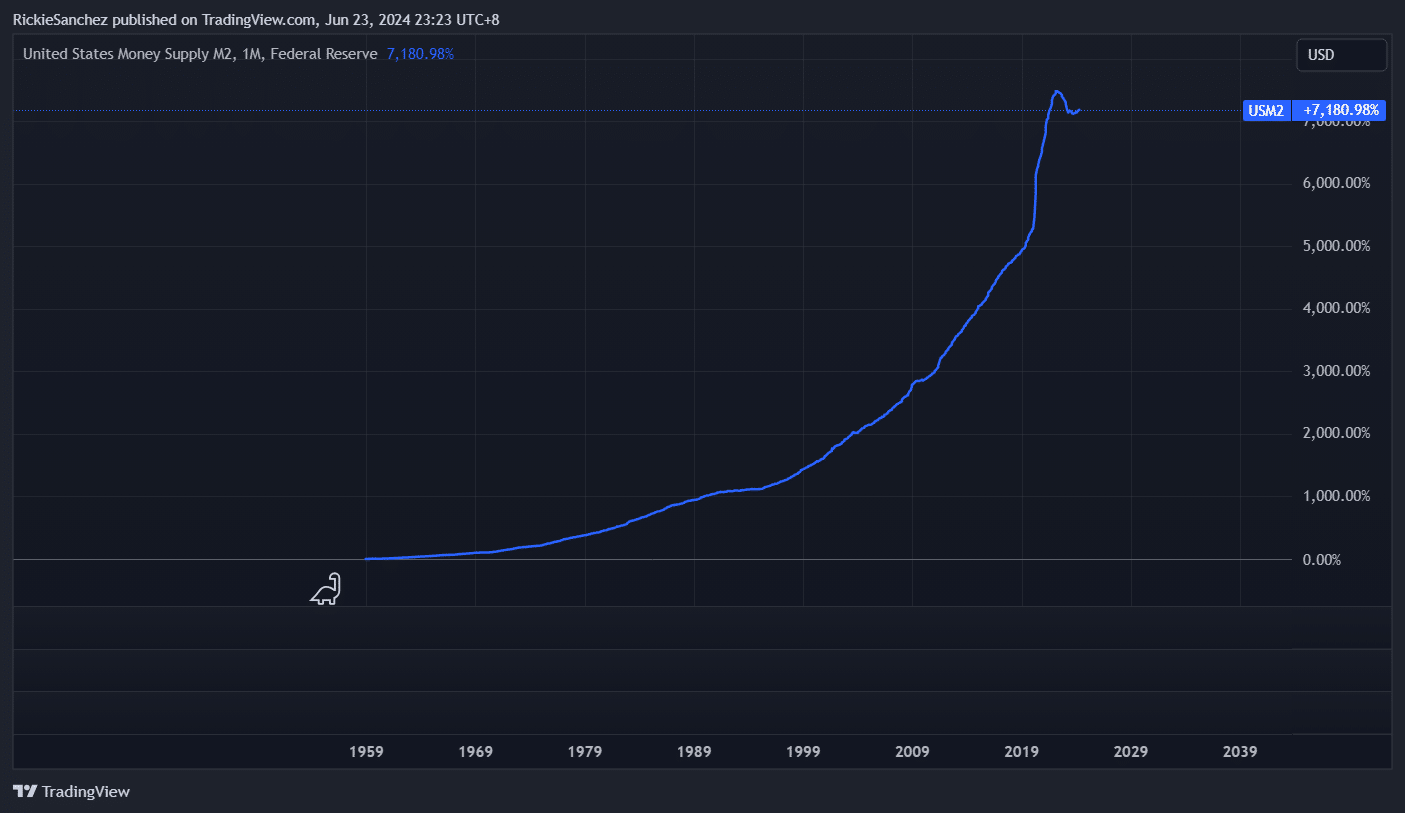
The M2 money supply chart reveals a dramatic rise in the US money supply since the 1950s. This increase coincided with the abolishment of the gold standard in the 1970s, which allowed the Federal Reserve greater flexibility in managing the money supply.
Now, let’s try to compare the M2 money supply with Bitcoin.
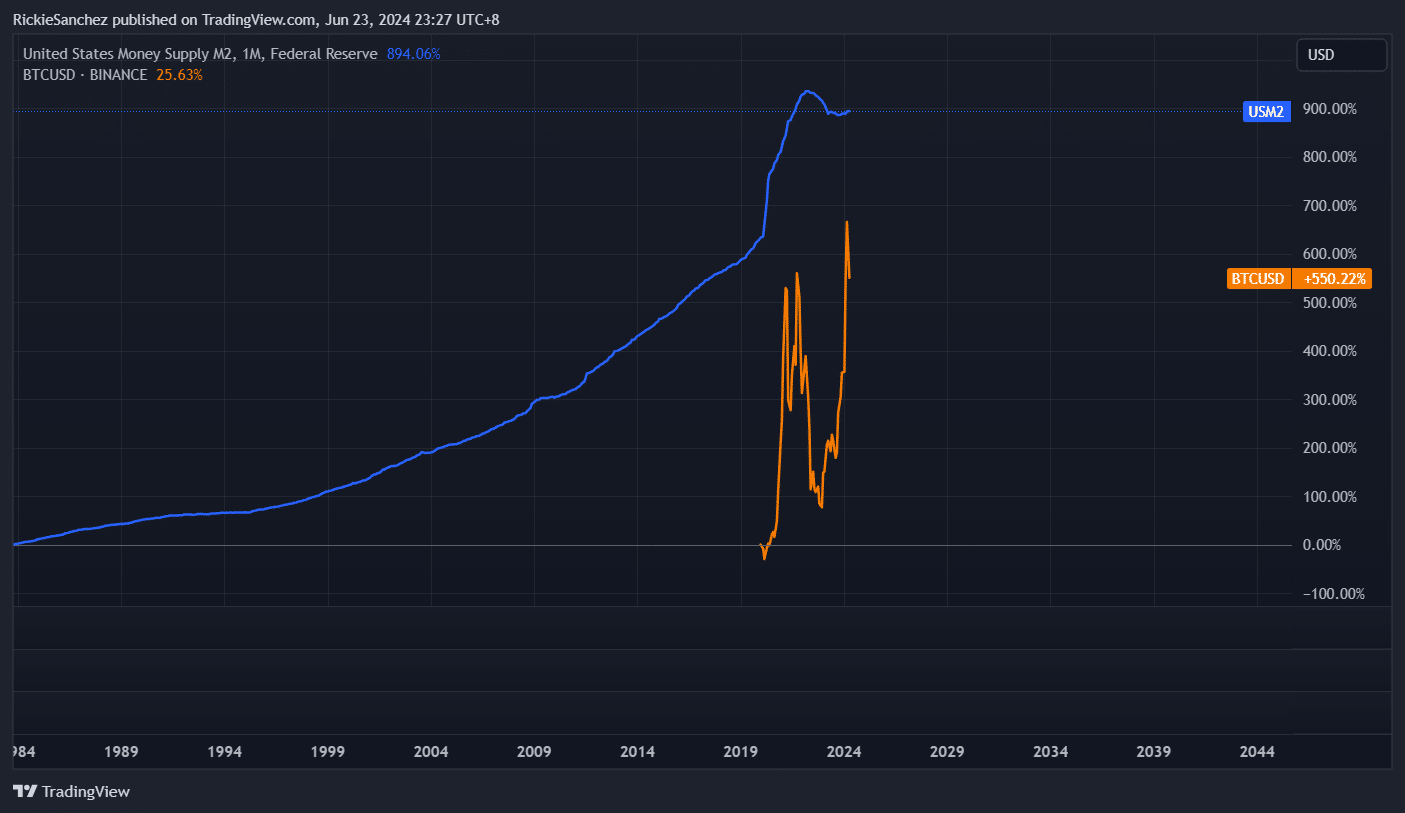
If we compare the M2 supply and Bitcoin through a chart, the key takeaway is not the chart itself. Instead, it actually shows how the Federal Reserve’s actions impact both. If the Federal Reserve is printing more money, that means the economy is being pumped, which gives traders and investors the notion that the Fed is now dovish in its stance and is more willing to cut interest rates.
Bitcoin And GLI Correlation
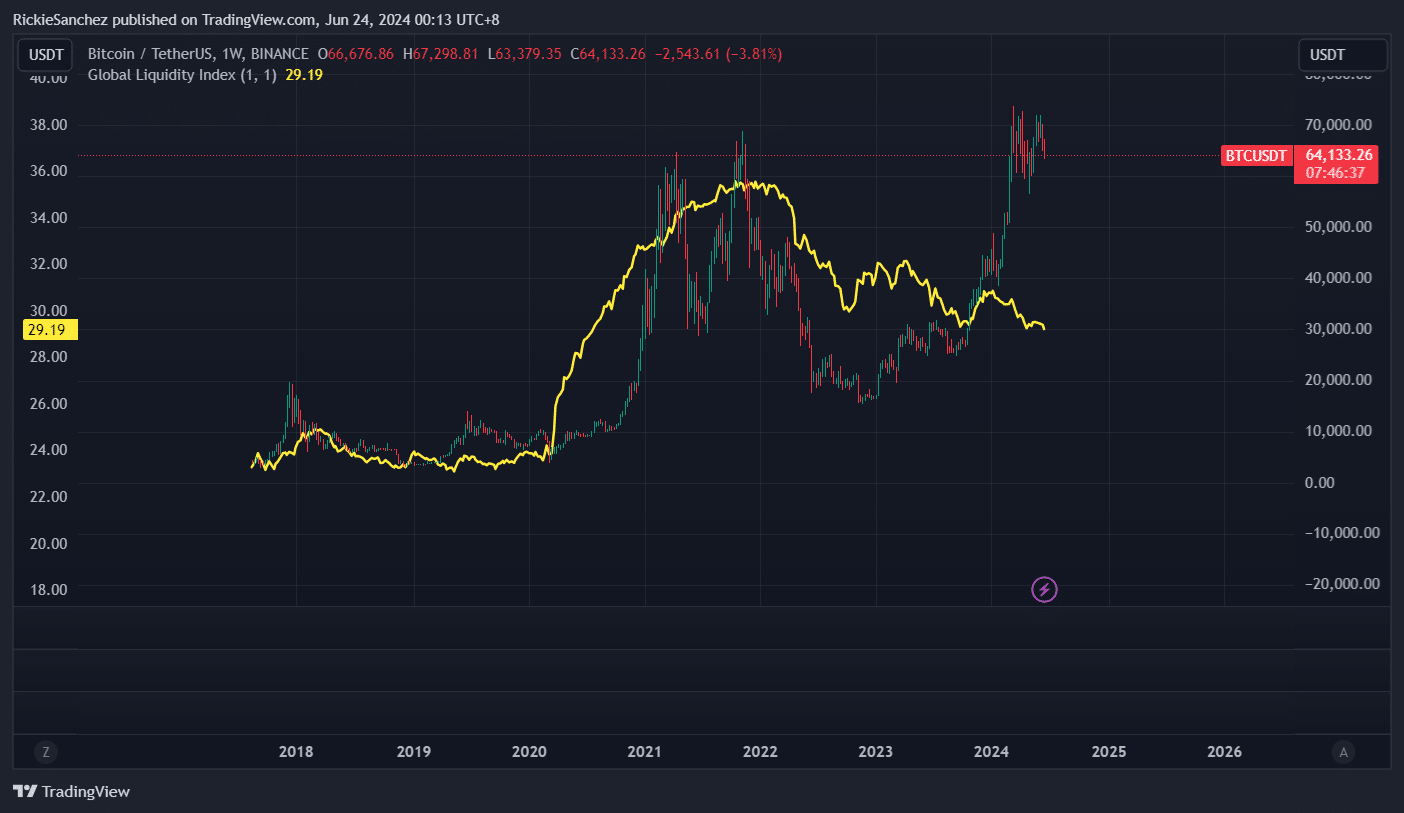
Historically, there has been a strong correlation between GLI and Bitcoin on the weekly chart. However, in the first half of 2024, this correlation weakened, even though Bitcoin’s price continued to rise.
While the GLI and Bitcoin’s price movement appear correlated, it is important to remember that other factors can influence Bitcoin’s price. For example, the excitement surrounding Bitcoin spot ETFs in the first few months of 2024 was a significant driver for the price of Bitcoin, independent of the GLI. In other words, even though there’s a correlation, there are specific events that can move Bitcoin’s price independently.
What the Liquidity Index Can Tell You
In conclusion, although the Global Liquidity Index does not directly correlate with Bitcoin’s price performance, it does indicate whether the market is moving towards a tighter or looser monetary policy. Additionally, while it serves as a helpful indicator of the money supply, its interpretation can also vary widely.
More on Bitcoin: Bitcoin hub · Bitcoin price today · Bitcoin price prediction · How to buy Bitcoin safely