The TRX/BTC crypto pair is now at a critical support level, after the generalized downturn in the cryptocurrency market forced most of the cryptos down. However, TRX/BTC did not experience a lot of downside, unlike the situation with Ethereum which saw the major dApp provider lose nearly 30% of its market value. This TRX/BTC analysis presents the outlook for the next few weeks as regards price action for this crypto pairing.
Fundamental Outlook
CEO Justin Sun continues to blow the cryptocurrency’s trumpets and has continued to dish out reasons as to why developers of decentralized apps should ditch Ethereum and patronize Tron. Binance has also started to promote TRX in its Info Gold Label Project. However, this news have not had much of an effect on recent price action of TRX/BTC. Traders seem more interested in the general market sentiment at the moment.
Technical Outlook
The weekly chart shows that Tron price action has been bearish over the last three weeks, driving price action to the previous support levels that had been attained in March 2018 as well as August – September 2018.

TRX/BTC Weekly Chart: November 27, 2018
These levels are being tested once more, but have so far held firm. We can also see the 50-EMA line providing dynamic resistance to price action, and this is also intact. We also notice that volumes of trade on this asset are presently low, even though the available volumes indicate that the predominant volume is on the selling side of the equation.
Let us now step down to the medium term outlook chart (daily chart) to get a clearer view of what is happening in the market.

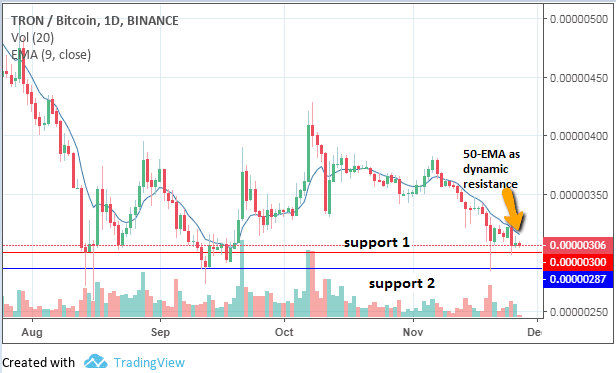
TRX/BTC Daily Chart: November 27, 2018
This chart reveals the following:
- There are two possible levels at which the price action will most likely find support. First is the 0.000003 price level (red horizontal line), which has been tested in August as well as early November 2018. We also have another support line below it (0.00000287), representing an area where price had hit a low in September 2018.
- Volume for this week has been relatively low. This is not surprising, as price action is close to the initial support level and traders are realigning their positions to decide on whether to push against this support or to buy off it.
- The 50-EMA line continues to play a vital role as a dynamic resistance line.
The situation on both charts provides some information as to how to proceed with the trading of this pair.
Trade Scenario
One scenario which may play out is that the initial support at 0.000003 may prove too strong for sellers to breach, and this may provide an area where traders may decide to perform quick bounce trades to the upside. However, the looming 50-day exponential moving average may limit any upside movements and keep them at the barest minimum. Given that the sentiment in the market is still bearish, it may be too early to trade on a bounce. Indeed, price may decide to test support several times in the next week or two without any concrete definition of direction of movement. So caution is advised.
In any case, any moves to the upside (such as a strong bounce) have to be supported by strong buying volumes and by price break of the 5o-EMA line.
Trade Scenario 2
A successful break of the initial support will open the door for price to move on to the next support level at 0.00000287. Price has tested this area at least once this month and bounced nicely, but found the 50-EMA too tough to crack. It is likely we can have a retest of this area if price breaks below the initial resistance. From here, we can even have prices trading in a range for some time.
Market Sentiment:
The long-term and mid-term outlook of the TRX/BTC pair is:
- Long-Term – neutral to bullish
- Mid-term – neutral to bearish
Please note: this analysis was done on a weekly chart. It takes a whole week for a candle to form, so these moves may take several weeks to play out. Entries should be made on shorter time frame charts such as the daily chart.
Learn More
Want to learn more about TRON? Read about how Tron’s transactions have passed other major coins in our in-depth article. You can also read about how Tron’s price was boosted earlier this year with the rumor of a big partnership.
The best place to buy or trade for TRX is on Binance. After, you can utilize the great features of TronWallet to hold your TRX.


