Key Takeaways
- Bitcoin MVRV Z-score compares Bitcoin’s market value to its realized value, expressed as standard deviations from the historical mean.
- Z-score readings above 7 have historically marked major cycle tops. Readings below 0 have marked cycle bottoms.
- The metric works best for long-term cycle analysis, not short-term trading decisions.
The bitcoin MVRV Z-score is one of the most respected on-chain valuation tools in the analyst community. It gives investors a way to assess whether BTC is statistically overvalued or undervalued relative to its own history. Unlike price charts alone, the MVRV Z-score incorporates where coins actually traded hands, making it a more grounded measure of market sentiment.
What the MVRV Z-Score Actually Measures
To understand the Z-score, you need to understand two underlying concepts first.
Market Value (MV) is simply Bitcoin’s current market capitalization: the current price multiplied by circulating supply. This is the number most people track daily.
Realized Value (RV) is different. It calculates the value of every bitcoin at the price it last moved on-chain. A coin that last transacted at $20,000 contributes $20,000 to the realized cap, regardless of what BTC trades at today. This gives you a measure of the aggregate cost basis of all Bitcoin holders.
The MVRV ratio divides market value by realized value. When MVRV is high, the market is pricing BTC significantly above what holders paid on average. When MVRV is near 1, BTC is trading close to the aggregate cost basis.
How the Z-Score Refines the Raw MVRV Ratio
The Z-score takes the MVRV ratio a step further. It measures how many standard deviations the current MVRV sits above or below its historical average. This normalization removes the effect of Bitcoin’s long-term price growth and lets you compare readings across different market cycles on an equal footing.
The Z-score formula: (Market Value minus Realized Value) divided by the standard deviation of (Market Value minus Realized Value) over the full historical dataset.
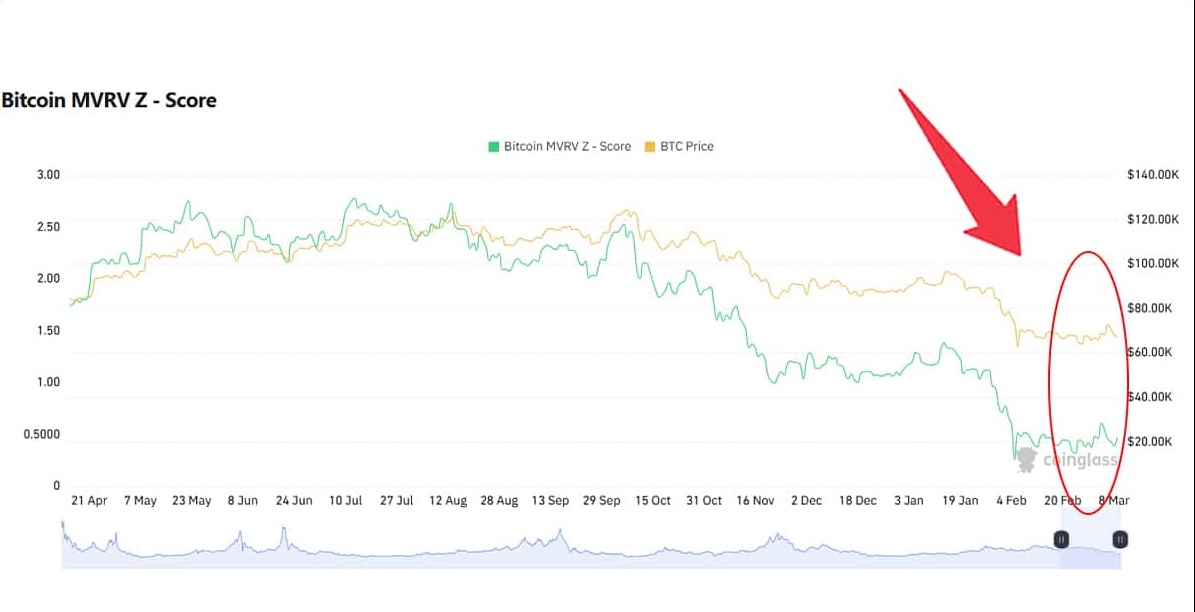
Red zones on the MVRV Z-score chart have historically appeared when the Z-score exceeded 7. These red zones have aligned closely with each major Bitcoin cycle top. Green zones appear when the Z-score drops below 0, indicating that realized value exceeds market value. This means the average holder is underwater, a condition historically associated with cycle bottoms.
How to Read the Current MVRV Z-Score
The MVRV Z-score updates daily and is publicly available on Glassnode, LookIntoBitcoin, and CryptoQuant. Here is how to interpret readings in context:
- Z-score above 6 to 7: Historically high-risk territory. Previous cycle tops in 2013, 2017, and 2021 all saw readings in this range. This does not mean a top is imminent, but risk management becomes a priority.
- Z-score between 2 and 5: Mid-cycle range. BTC is above its realized value but not at extreme overvaluation. This is typical of the accumulation-to-markup phase in a bull market.
- Z-score between 0 and 2: Low valuation territory. BTC is trading close to or just above its aggregate cost basis. Historically a favorable zone for long-term accumulation.
- Z-score below 0: Capitulation territory. Realized value exceeds market cap, meaning the average holder is at a loss. Previous readings below 0 in 2018 and 2022 marked the deepest parts of bear markets.
For tracking the current reading, Glassnode and LookIntoBitcoin display live MVRV Z-score charts. These platforms also show the historical context that makes the current reading meaningful. The crypto analytics platforms guide covers additional on-chain tools that pair well with MVRV analysis.
MVRV Z-Score vs. Other On-Chain Valuation Metrics
The MVRV Z-score is powerful, but it works best alongside other metrics. Here is how it compares and complements a few of the most commonly used tools:
- Puell Multiple. Measures miner revenue relative to its historical average. Useful for spotting sell pressure from miners. MVRV Z-score captures broader market sentiment, while Puell Multiple focuses on the supply side.
- Stock-to-Flow (S2F). Models BTC price based on scarcity following halvings. S2F is a price model. MVRV Z-score is a valuation measure based on actual on-chain cost basis, making them complementary rather than competing.
- Realized Profit/Loss Ratio. Shows whether coins moving on-chain are doing so at a profit or loss. This gives a real-time snapshot of holder behavior that adds context to what the MVRV Z-score suggests about overall market positioning.
For long-term Bitcoin holders managing position sizing based on cycle stage, keeping BTC in secure self-custody during accumulation phases makes sense. Ledger and Trezor are the standard hardware wallet options. You can also review the top crypto research platforms for more on-chain data sources that support this kind of analysis.
Frequently Asked Questions
What is a dangerous MVRV Z-score for Bitcoin?
Readings above 6 to 7 have historically aligned with cycle tops. Previous major peaks in 2013, 2017, and 2021 all saw the Z-score reach this range before significant corrections followed.
Where can I check the bitcoin MVRV Z-score today?
Glassnode, LookIntoBitcoin, and CryptoQuant all publish live MVRV Z-score charts. Most require a free account to access the full historical view.
Is a low MVRV Z-score always a buy signal?
Not always, but historically readings below 0 have corresponded to the most favorable long-term buying conditions. A Z-score below 0 means BTC is trading below the aggregate cost basis of all holders.
How often does the MVRV Z-score update?
The metric updates daily as new on-chain data is processed. It does not provide real-time intraday signals, which is why it is best used for cycle-level positioning rather than short-term trading.
Can the MVRV Z-score predict the exact Bitcoin top?
No metric predicts exact tops. The MVRV Z-score identifies elevated risk zones based on historical patterns. Traders use it to adjust position size and risk exposure rather than to time precise exits.