Key Takeaways
- The Relative Strength Index (RSI) measures momentum on a scale of 0 to 100, with 70+ signaling overbought and 30 or below signaling oversold.
- Bitcoin’s RSI frequently spends extended time above 70 during bull runs without immediately reversing, which makes timeframe selection critical.
- RSI works best as a confluence tool alongside volume, trend structure, and on-chain data rather than as a standalone signal.
The bitcoin RSI current value is one of the most-checked numbers among BTC traders. RSI is a momentum oscillator developed by J. Welles Wilder in 1978. It tells you how fast and how hard price has moved in one direction over a set period. For Bitcoin specifically, RSI behaves differently than it does on traditional assets, and knowing that difference changes how you use it.
How Bitcoin RSI Is Calculated
RSI measures the ratio of average gains to average losses over a lookback period, typically 14 candles. The formula produces a number between 0 and 100. Higher readings mean recent gains outpaced losses. Lower readings mean the opposite.
The standard interpretation holds that RSI above 70 signals an overbought asset and RSI below 30 signals an oversold one. On most traditional stocks, these thresholds work reasonably well. Bitcoin is a different case.
Why Standard RSI Thresholds Need Adjustment for BTC
Bitcoin trends aggressively. During strong bull markets, BTC’s daily RSI can stay above 70 for weeks or even months. A trader who sold every time RSI crossed 70 during the 2020 to 2021 bull run would have missed a 10x move.
Several experienced Bitcoin analysts use adjusted thresholds:
- Bull market range: RSI between 40 and 90 is considered the normal operating range. A pullback to 40 is treated as a buying zone rather than a neutral signal.
- Bear market range: RSI between 10 and 60 is considered normal. A bounce to 60 can serve as a resistance signal.
The practical takeaway is that the timeframe and market cycle phase matter more than the absolute RSI number.
How to Read Bitcoin RSI Across Timeframes
Different timeframes give different signals. Here is how traders approach each:
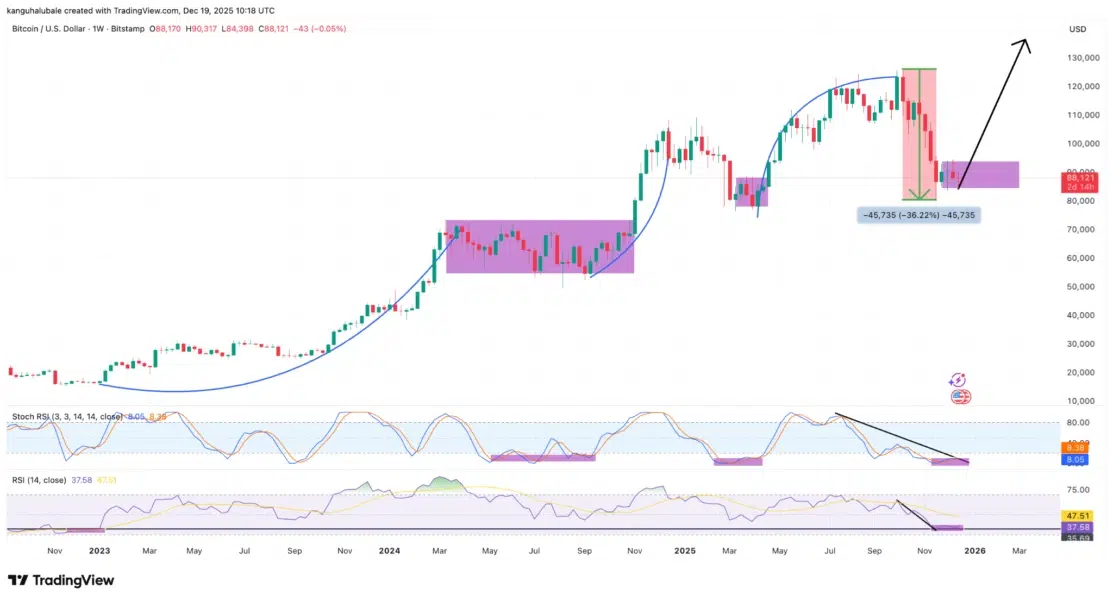
- Weekly RSI. The most reliable for macro trend analysis. Weekly RSI above 80 in previous cycles has historically preceded major corrections within 4 to 12 weeks. It triggered near the tops in 2017, 2021, and early 2025.
- Daily RSI. Useful for swing trade entries and exits. Daily RSI crossing above 70 after a consolidation period often confirms the start of a new leg up. Daily RSI dropping below 40 during a bull market signals a potential buy zone.
- 4-hour RSI. Relevant for short-term traders positioning around specific support or resistance zones. Less reliable in isolation but useful for timing entries after daily-level signals appear.
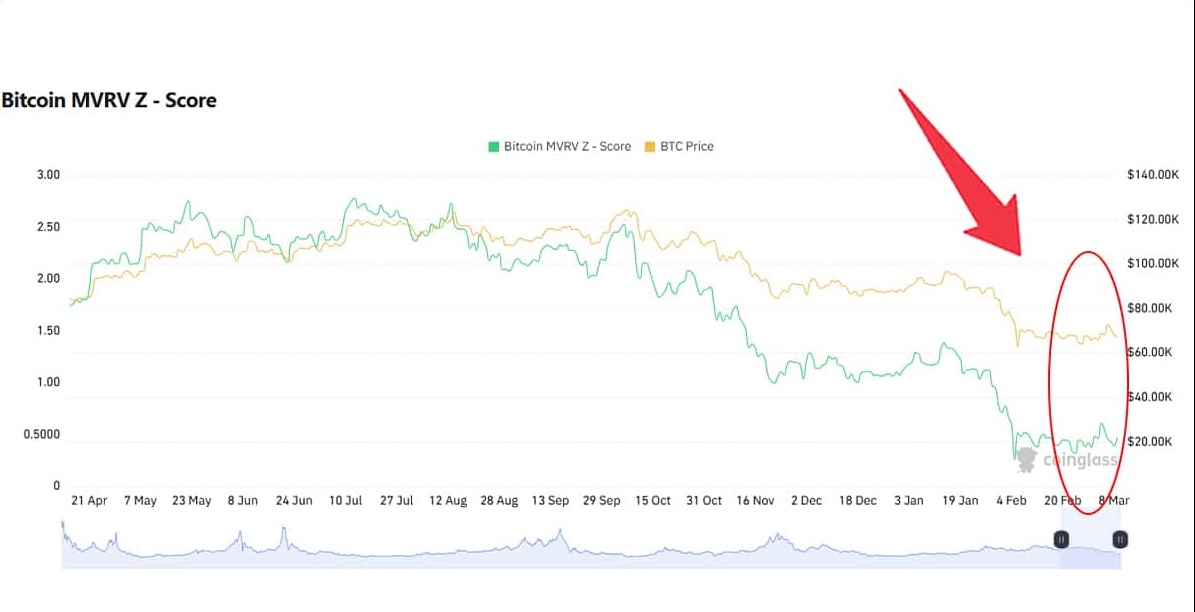
For the most current Bitcoin RSI reading, TradingView and Coinglass both display RSI across all timeframes in real time. You can also combine RSI with liquidation data using tools covered in crypto analytics platforms.
RSI Divergence: The Signal Most Traders Miss
RSI divergence is more valuable than raw threshold readings for many experienced traders. Divergence occurs when price and RSI move in opposite directions.
There are two types:
- Bearish divergence. Price makes a higher high, but RSI makes a lower high. This means upward momentum is weakening even as price climbs. It often precedes a correction.
- Bullish divergence. Price makes a lower low, but RSI makes a higher low. Selling pressure is easing even as price falls. This frequently precedes a recovery.
Divergences on the weekly and daily chart carry more weight than those on shorter timeframes. A bearish divergence on the weekly RSI near previous cycle tops has been one of the more reliable signals in Bitcoin’s history.
For traders using bots to act on RSI signals automatically, Coinrule and Cryptohopper both support RSI-based trigger conditions. The top crypto trading bots page covers more options for systematic RSI strategies.
Frequently Asked Questions
What is a good RSI value for Bitcoin?
There is no single good value. In a bull market, RSI between 50 and 70 on the daily chart often represents healthy momentum without being overextended. RSI dropping to 40 during a bull market uptrend is frequently a buying opportunity.
Does high RSI always mean Bitcoin will drop?
No. Bitcoin can sustain high RSI readings for extended periods during strong uptrends. High RSI signals caution and calls for tighter risk management, but it does not confirm a reversal on its own.
What timeframe RSI is most accurate for Bitcoin?
The weekly RSI provides the most reliable macro signals. Daily RSI is the most commonly used for swing trading. Shorter timeframes produce more noise and require additional confirmation.
What is RSI divergence and why does it matter?
Divergence occurs when RSI and price move in opposite directions. Bearish divergence warns that upward momentum is fading. Bullish divergence suggests selling pressure is declining. Both are useful early warning signals before a trend changes.
Where can I check Bitcoin’s RSI in real time?
TradingView is the most widely used platform for live RSI data across all timeframes. Coinglass and most major exchanges also display RSI in their charting tools.