
BNB was trading at $585.81 on July 7, 2026, down 0.8% over the past 24 hours after moving inside a $569.93 to $592.19 range. The token is up 4.75% over the past seven days, a gain that still trails the broader crypto market’s 8.40% move over the same stretch.
At that price, BNB carries a market capitalization of $78.96 billion, keeping its rank as the fourth-largest cryptocurrency, though it remains 57.24% below the all-time high of $1,369.99 it set on October 13, 2025.
What Happened This Week
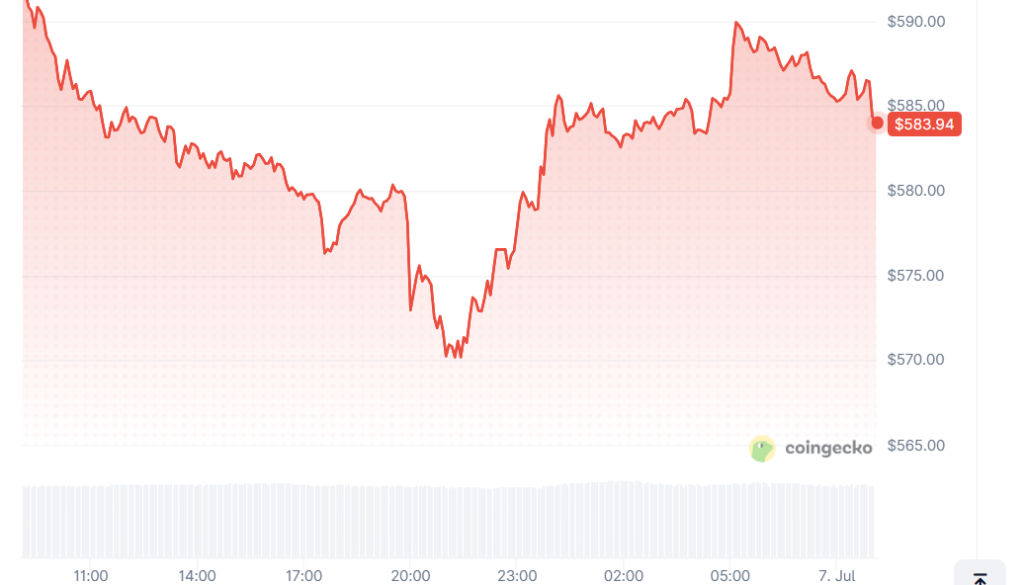
The past seven days told a choppier story than the daily chart suggests. BNB swung between $536.28 and $592.82 over that stretch, according to CoinGecko, spending much of it grinding sideways rather than trending in one direction. Trading activity picked up alongside the bounce off the lower end of that range, with roughly $794.9 million in volume moving over the past 24 hours, a 4% increase from the prior day.
That pattern, a wide range with rising volume but no clean breakout, echoes what has played out across much of this year’s altcoin price action, where large-cap tokens have largely tracked Bitcoin’s lead rather than posting independent breakouts.
The technical picture is narrower than the weekly swing suggests. According to CoinMarketCap’s CMC AI market desk, dated July 4, 2026, BNB needs to hold support between $563 and $568 to keep its shot at retesting resistance near $595 to $602. A break below that band, the desk noted, opens the door to a slide toward $540.
Historical Context: BNB Since the October 2025 Peak
This kind of range-bound grind is not new territory for BNB. The token hit its all-time high of $1,369.99 on October 13, 2025, then spent the following months unwinding that rally in stages instead of collapsing all at once. The pattern is not unlike the one Bitcoin itself has traced since its own last cycle.
By comparison, the current $536 to $593 band looks less like a breakdown and more like the same consolidation pattern BNB has repeated since the October peak: a sharp move, then weeks of base-building before the next leg. Holders who bought near the highs are still sitting on steep losses, while holders who bought below $600 in recent months are roughly flat to modestly ahead.
What Analysts Are Saying
BNB’s short-term price action is tracking Bitcoin more than it is reacting to anything specific to the BNB Chain, according to CoinMarketCap’s CMC AI market desk on July 4, 2026. The desk attributed that day’s move to “positive market beta as capital rotated into large-cap crypto assets,” rather than a coin-specific catalyst.
The bigger, slower-moving story is institutional. CoinDesk’s Francisco Rodrigues reported on January 27, 2026, that a physically backed BNB exchange-traded product had launched on Nasdaq Stockholm, adding to the list of regulated ways to gain BNB exposure outside a crypto exchange.
Two weeks earlier, on January 13, 2026, CoinDesk reported that Grayscale had filed for a U.S. BNB ETF around the same time BNB Chain’s Fermi hard fork improved the network’s throughput and finality. Those filings are still part of the backdrop investors are weighing heading into the second half of 2026.
Not every headline has been bullish. CoinDesk reported on January 8, 2026, that BNB’s price action was also being shaped by an internal dispute at a major BNB treasury company, where one shareholder, YZi, accused the firm’s leadership of mismanagement and poor communication and pushed for board changes and disclosure of its BNB holdings. That kind of governance overhang tends to fade slowly, and it remains a live risk factor rather than a resolved one.
The $568 Level That Decides BNB’s Next Move
The near-term setup comes down to a fairly narrow band. Hold above the $563 to $568 support zone identified by CoinMarketCap’s CMC AI desk, and BNB has room to retest $595 to $602 resistance. Lose it, and the more bearish read points toward $540. Longer term, the pending Grayscale and Nasdaq-style BNB ETF products are the catalyst worth tracking beyond the daily chart, since regulatory movement on either could shift BNB’s price more than any single technical level.
This article is for informational purposes only and does not constitute financial advice. Do your own research before making any investment decisions.
Frequently Asked Questions
BNB’s price swings raise a handful of questions every week. Here are the ones tied to this specific setup.
What is BNB’s price today?
BNB was trading at $585.81 on July 7, 2026, down 0.8% over the previous 24 hours, according to CoinGecko.
Why is BNB stuck between $536 and $593?
The range reflects a lack of a fresh, coin-specific catalyst. CoinMarketCap’s CMC AI desk attributed BNB’s recent price action to broader market beta tracking Bitcoin, rather than BNB-specific news, as of July 4, 2026.
What would change BNB’s direction from here?
A daily close above $595 to $602 would support a bullish case, per CoinMarketCap’s CMC AI technical read from July 4, 2026. A break below the $563 to $568 support zone opens the door to a test of $540.