
XRP is trading between $1.06 and $1.07, roughly 43% lower on the year, with the 200-day EMA sitting 31% overhead and sloping down while the CLARITY Act remains stalled in the Senate without a scheduled floor vote.
Inside XRP’s Nine-Week Range
XRP opened Monday at $1.0858 and printed a low of $1.0618 before settling near $1.0662, down roughly 1.75% to 1.8%.
The token has spent the last nine weeks compressing between roughly $1.00 and $1.19 following a sharp June collapse from $1.30, with a series of slightly lower highs since then.
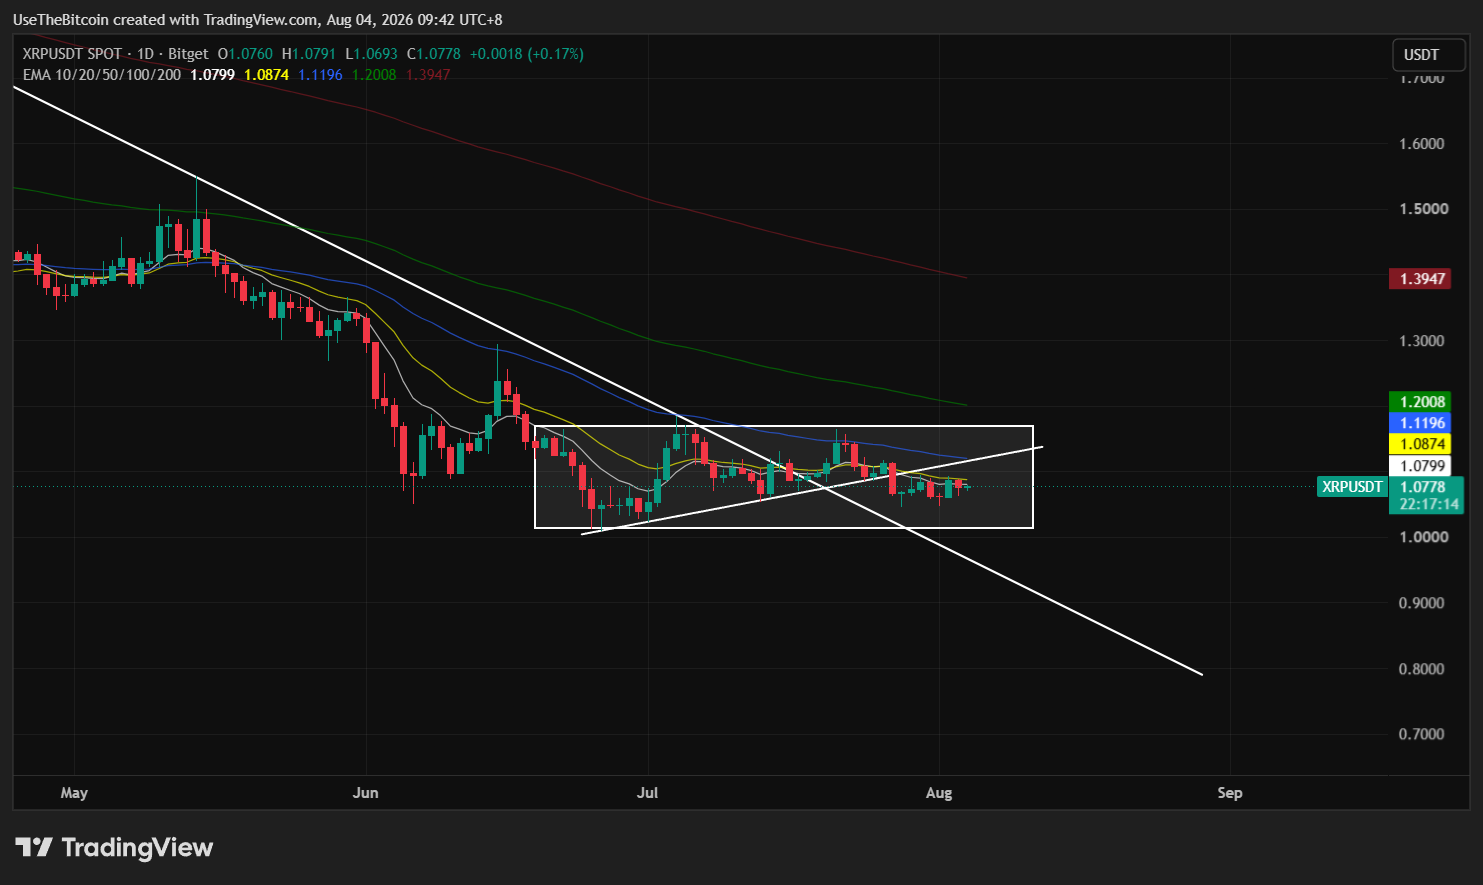
The descending trendline drawn from the May high near $1.50 has technically broken to the upside as of early August, but price immediately drifted back toward the middle of its range on a red daily candle afterward, which is a lapsed constraint rather than a confirmed reversal absent expanding volume and a genuine higher high.
Ripple’s routine August escrow release also factored into sentiment as up to 1 billion XRP can be released from escrow monthly, though Ripple typically returns around 700 million back into new escrow contracts, netting roughly 200 to 300 million XRP added to circulating supply, a predictable mechanism unlikely to be the sole driver of price weakness on its own.
As of early August, roughly 62.5 billion XRP sit in public circulation against about 32 billion still held in escrow, a transparent release schedule that gives investors clearer visibility into future supply than many other cryptocurrencies offer.
This week also brings a dense US economic data calendar, including the ISM Manufacturing PMI, JOLTs job openings, ADP private payrolls, the ISM Services PMI, weekly jobless claims, and Friday’s Non-Farm Payrolls report, any of which could shift Federal Reserve rate-cut expectations and broadly move risk appetite for crypto.
What the Indicators Show for XRP
RSI readings are in the mid-to-high 40s, specifically at 45.73 on the daily chart, and around 52 on the 4-hour timeframe, with the majority of the indicators in the neutral zone but well short of the oversold territory that produced a bounce during June’s low. Moreover, the MACD on the 4-hour sits only marginally above its signal line, indicating a lack of real recovery momentum.
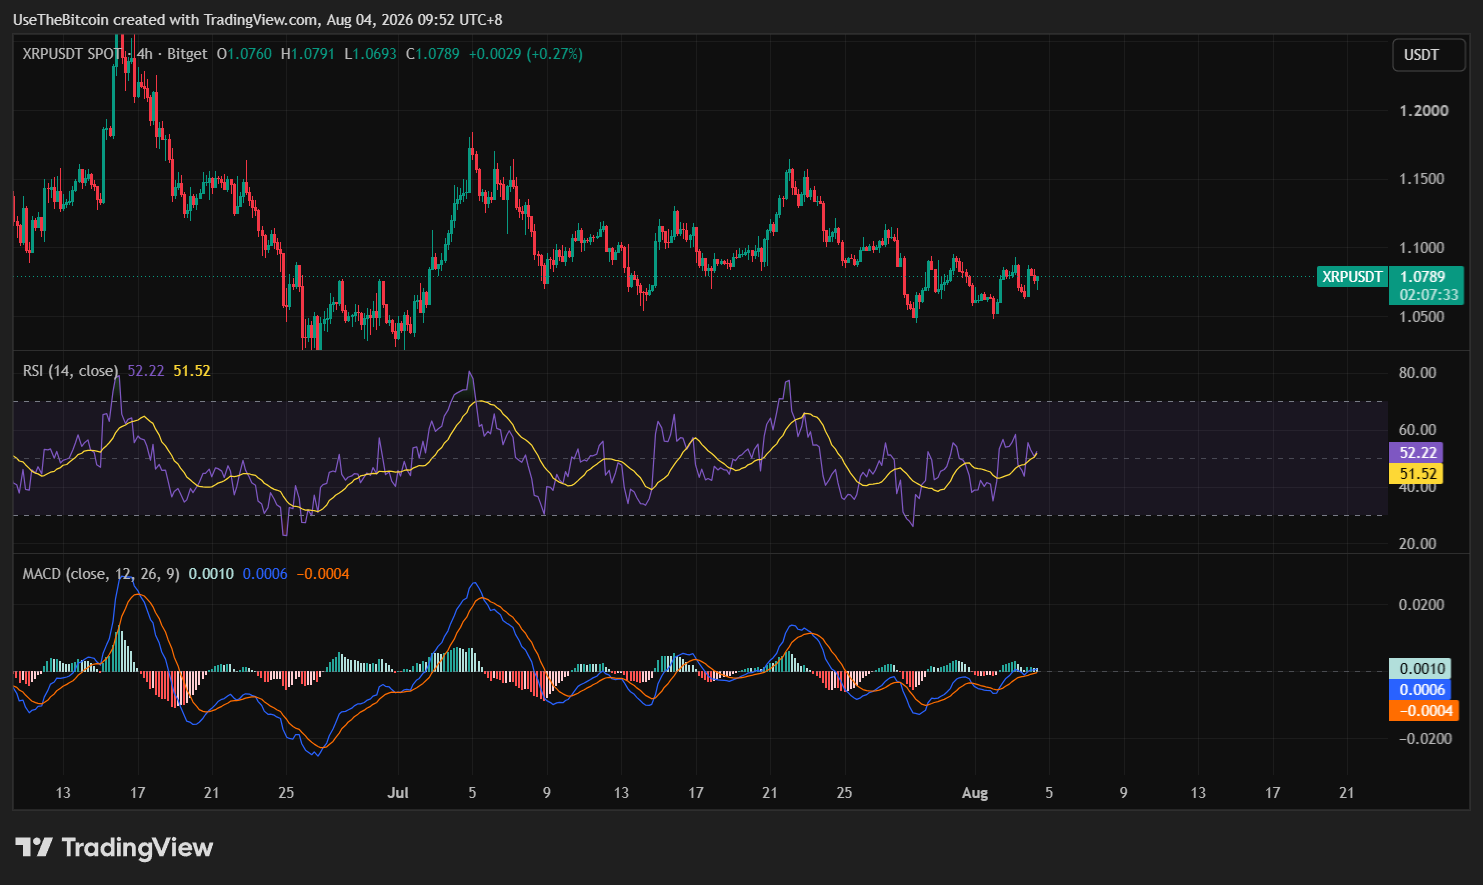
Within the same 4-hour timeframe, XRP is trading below both its 50-period moving average near $1.079 and its 100-period average near $1.101, preserving a bearish structure on that timeframe even as the daily chart shows the downtrend line has technically broken.
A confirmed close above $1.093 may trigger renewed buying interest, with $1.116 and $1.135 as the next upside targets and $1.066 as a natural stop-loss level for that setup.
| Level | Role | Notes |
| $0.89 | Deeper downside target | Could open if the $1.01-$1.04 zone breaks decisively |
| $1.00 | Psychological floor | Tested repeatedly since late June without breaking |
| $1.007-$1.027 | Near-term support cluster | From 4-hour chart analysis |
| $1.044-$1.066 | Immediate support | Current trading zone |
| $1.079-$1.093 | First recovery trigger | 50-period 4H moving average sits near $1.079 |
| $1.10-$1.116 | Near-term resistance | First upside target if $1.093 is reclaimed on a confirmed close |
| $1.12-$1.135 | Secondary resistance | Next target zone if the $1.10-$1.116 area clears |
| $1.15 | Key resistance shelf | Needs a daily close above to shift the structure |
| $1.157 | Additional resistance | Upper boundary of the near-term 4-hour resistance ladder |
| $1.20-$1.22 | Real trigger zone | A three-day close above this range is cited as the level needed to pull ETF desks back in |
| $1.24-$1.29 | Trend reversal zone | Needed alongside a broken descending trendline for a larger reversal |
| $1.39699 | 200-day EMA | Currently 31% above spot and still sloping down |
ETF and Institutional Demand for XRP
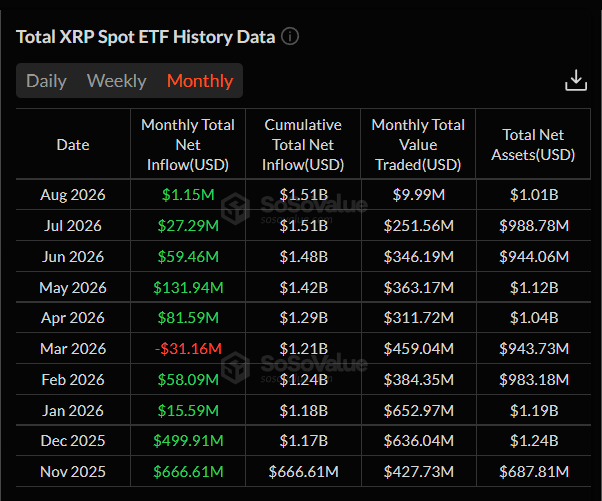
XRP ETFs recorded $27.29 million in net inflows for July, extending a four-month positive streak, though this represents a sharp slowdown from April’s $81.59 million, May’s $131.94 million, and June’s $59.46 million. Cumulative inflows sit near $1.5 billion, with US-listed XRP funds collectively holding just under 1 billion tokens.
On July 31 specifically, net inflows totaled $7.69 million, with Bitwise recording the greatest single-day demand at $7.12 million and Franklin Templeton at $576,520, while Canary, 21Shares, and Grayscale saw no new inflows that day.
For comparison, Bitcoin and Ethereum funds pulled in roughly $172 million and $365 million, respectively, in July, making XRP’s inflow look modest even during a positive streak.
Exchange balances remain near three-year lows, though the reduced exchange supply can’t sustain prices indefinitely against weak spot demand.
For more on this trend, see our coverage on the list of every XRP ETF Fund listed and how they compare.
The CLARITY Act Factor
The CLARITY Act would write XRP’s commodity classification into federal statute, moving oversight from the SEC to the CFTC, and its absence from Monday’s Senate floor schedule leaves the timeline tight ahead of a recess expected to begin around August 7 to 10.
Additionally, prediction markets have priced the odds of passage in 2026 at around 30%, and Standard Chartered has set a conditional $8 XRP target requiring both full Senate passage and $4 billion to $8 billion in fresh ETF inflows, a target that remains purely theoretical without a floor vote.
Seasonality and the Broader Backdrop for XRP
August is XRP’s flattest month historically, averaging a 0.43% return and closing red for four consecutive years, with the pattern reportedly worse in past midterm election years, when August returns averaged around -14 % across 2014, 2018, and 2022.
2026 is a midterm year, and seasonality alone isn’t a trading signal, but it’s a reason not to expect a catalyst to emerge without one of the above triggers firing.
To compare, Bitcoin’s own setup isn’t providing altcoins much of a tailwind either, closing July near $63,000, up about 7% for the month but still pressing against its own descending trendline from October 2025’s peak, with support holding in the $60,000 to $62,000 zone since June.
Bottom Line
At current prices, the reward-to-risk is asymmetric. Upside to the first real resistance near $1.15 is roughly 8%, while downside to the first meaningful target below the current range, near $0.89 to $0.85, is closer to 20%, an imbalance that improves meaningfully for buyers closer to the $1.00 to $1.02 zone rather than current spot.
A daily close below $1.00 would serve as a reasonable invalidation point for any bullish thesis, while a three-day close above $1.20 to $1.22 is the level several sources converge on as the point at which a bounce would start to look like a genuine trend change rather than another lower high.
If the Senate manages to schedule floor action before recess, that timeline could compress quickly. If it doesn’t, September becomes the earliest point the underlying story has a real chance to change.
Frequently Asked Questions
Need a refresher? Here are the questions traders are asking about XRP this week.
Is XRP a good buy at $1.06?
It depends on your time horizon. The setup favors a patient position over a short-term trade, since the reward-to-risk skews negative at current levels, roughly 8% upside to the first resistance versus 20% downside to the first target below the range. Buyers closer to $1.00-$1.02 face a meaningfully better setup than buyers at current spot.
Why does the 200-day EMA matter so much for XRP right now?
Price sits 31% below the 200-day EMA, and the average itself is still sloping downward, which is the technical definition of an established downtrend. Every rally since June has happened inside that broader bearish structure rather than representing a recovery from it.
Did XRP break its downtrend?
Only partially. The descending trendline from May’s high has technically broken higher, but price immediately drifted back toward the middle of its range afterward, without volume expansion or a confirmed higher high. That makes it a lapsed constraint rather than a confirmed reversal.
How much does the CLARITY Act matter for XRP’s price?
It matters more to XRP than to almost any other major token, since the bill would convert an existing SEC and CFTC interpretive classification into permanent federal law. Without a floor vote, the institutional catalyst tied to that permanence stays theoretical, and Standard Chartered’s conditional $8 target explicitly requires full Senate passage to even become relevant.
Are XRP ETF inflows a bullish signal here?
They’re a mixed one. Inflows have stayed positive for four straight months, but July’s total marked a sharp slowdown from May’s pace, and the token remains roughly 40% lower over the same period those inflows were arriving. That gap suggests ETF demand alone isn’t large enough right now to offset selling pressure elsewhere in the market.