
Bitcoin has spent the past week testing resistance near $80,000 after a sharp rebound from mid-August lows, even as Bernstein analysts published long-term price targets projecting Bitcoin could reach $300,000 by 2029 and $1 million by 2033 under their base case.
How the Price Moved for Bitcoin This Week
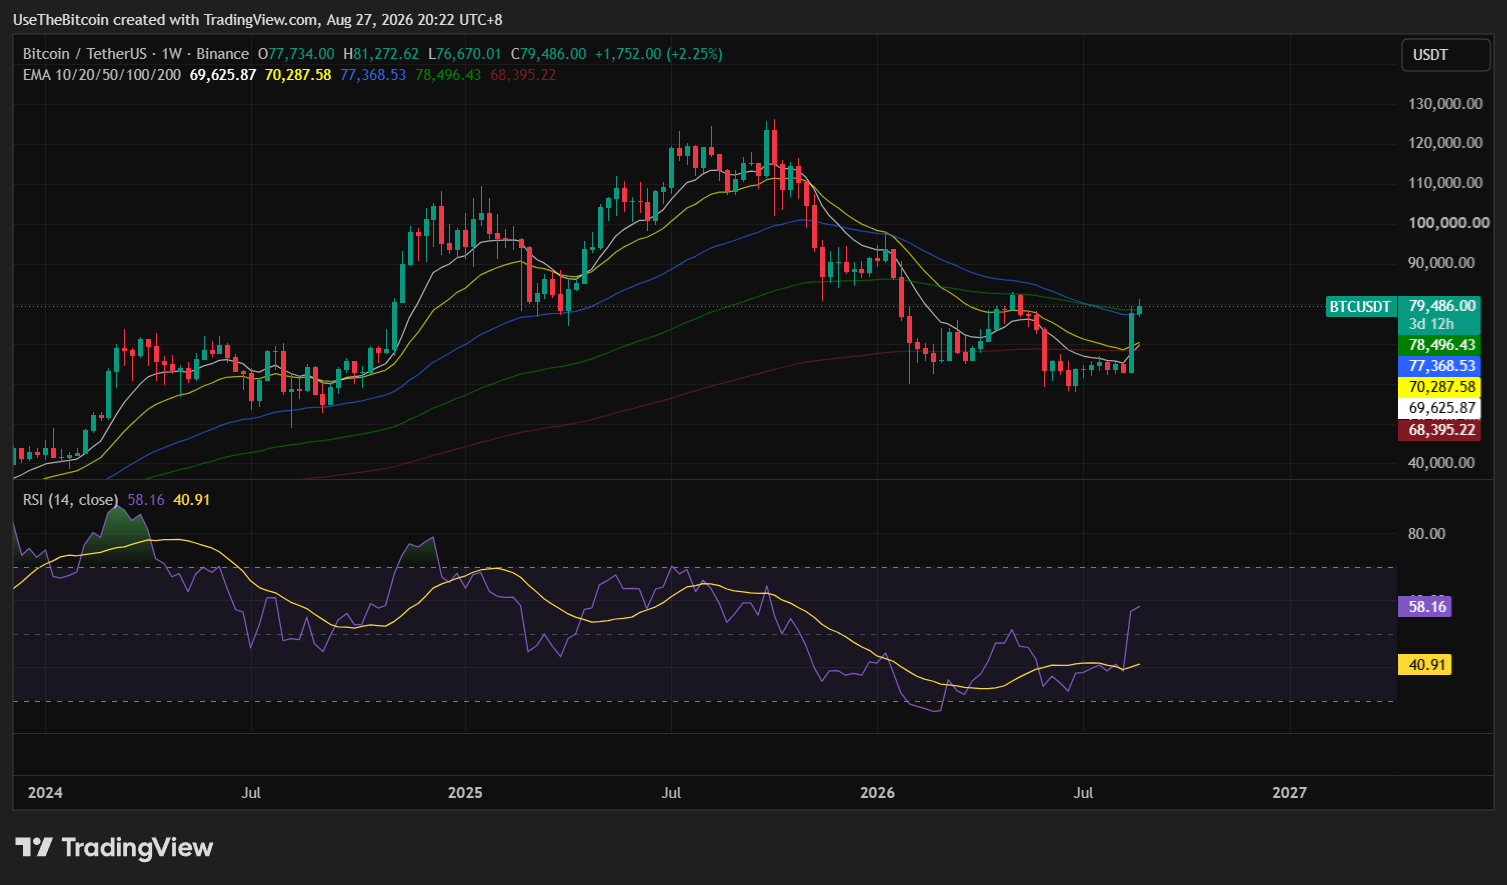
Bitcoin traded near $64,905 on August 8, then climbed toward $69,266 by August 19. As the price surged to $79,000 before the week ended, more than $1 billion in short liquidations occurred, described as the largest Bitcoin short squeeze on record.
The rally continued this week, reaching an intraday high near $81,200 on August 25 before sellers pushed it back below $77,000. By August 27, Bitcoin was pushing back toward the $80,000 level again.
Crypto trader Crypto Patel flagged the August 25 rejection specifically, noting the daily candle formed an inverted hammer pattern near $81,300, a shape that can indicate selling pressure after an advance, though he noted that one candle alone does not confirm a broader reversal.
Patel identified $83,000 as the level that would invalidate his bearish case, and projected a decline toward $55,000 to $50,000 if Bitcoin failed to reclaim that resistance.
| Level | Role | Notes |
| $50,000-$55,000 | Downside scenario | Price to fall back into if resistance is not reclaimed |
| $63,500-$64,905 | Recent low | Mid-August starting point for this rally |
| $69,266 | Prior resistance | Site of the largest recorded Bitcoin short squeeze |
| $75,000-$76,000 | Nearby support | Watched if the $80,000 level fails to hold |
| $79,172-$81,300 | Current trading zone | Where price has moved through the past several days |
| $80,000-$83,000 | Immediate resistance | Upper boundary of the recent trading range |
| $83,000 | Bearish case invalidation | A sustained close above this level weakens Patel’s downside scenario |
What the Derivatives Data Shows
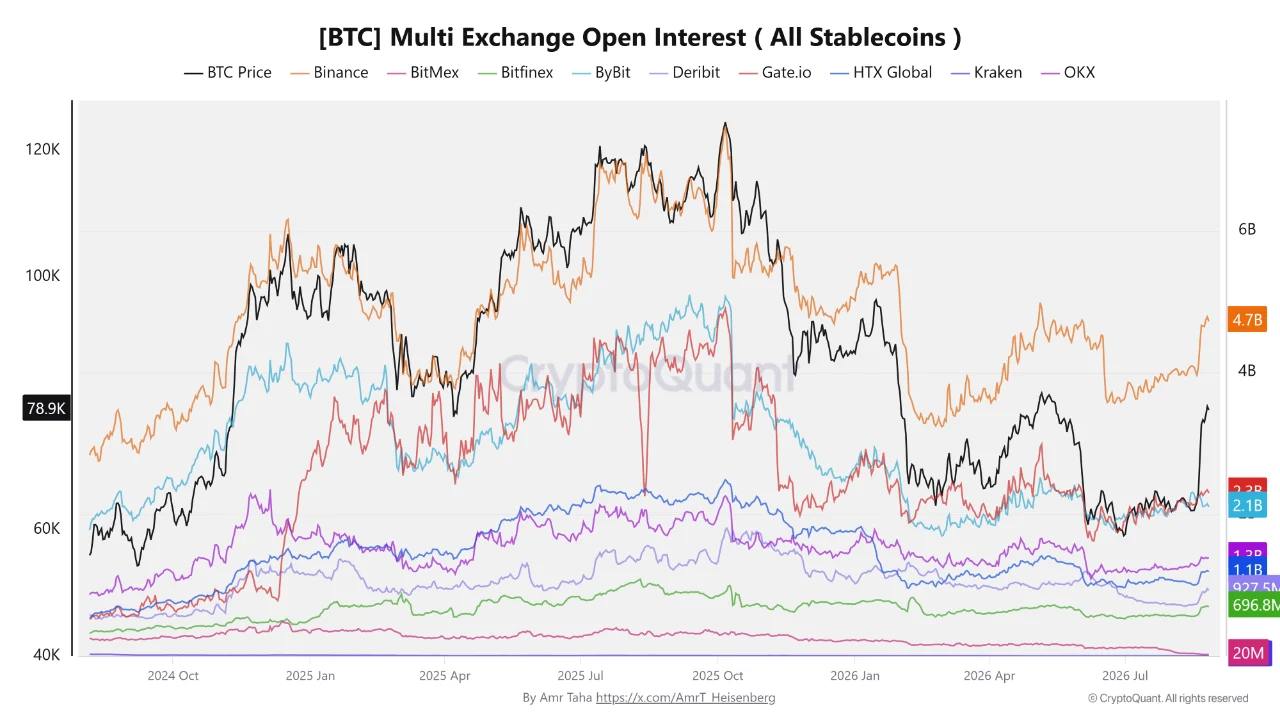
CryptoQuant data showed dollar-denominated Bitcoin futures open interest near $55.8 billion on August 26, with futures volume exceeding $98 billion over the prior 24 hours and roughly $325 million in liquidations during that window.
Moreover, coin-denominated data from Santiment showed open interest measured in actual Bitcoin fell 11% to about 312,600 BTC, its lowest level in a month, even as the price climbed from roughly $63,500 to nearly $77,700 over the same stretch.
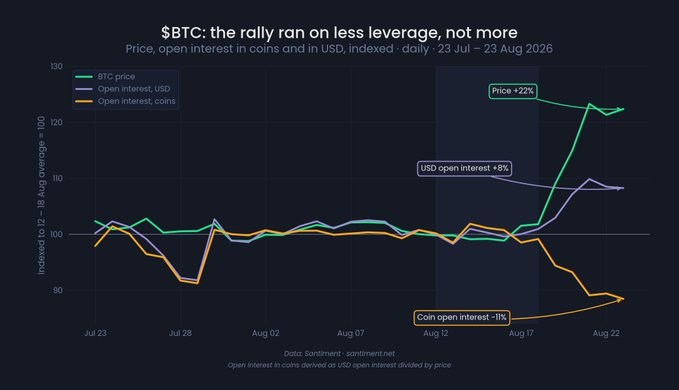
Dollar-denominated open interest still rose about 8% over that period, but only because each existing Bitcoin position became more valuable, not because traders opened a wave of new leveraged positions. This suggests the advance was not primarily driven by fresh leverage entering the market, which reduces one source of immediate liquidation risk if volatility picks up again.
Exchange-level data added further texture. Binance’s stablecoin-margined Bitcoin open interest reached $4.78 billion on August 25, exceeding its May 14 peak of $4.74 billion, while Gate, Bybit, and HTX all remained below their own earlier May peaks, suggesting leverage rebuilding has concentrated more heavily on Binance.
ETF Flows Have Been a Steady Tailwind
Spot Bitcoin ETFs extended their inflow streak to seven consecutive trading sessions through August 25, with SoSoValue data showing $314 million in net inflows that day alone.
Glassnode data covering the same broader week showed a fuller picture, with $1.6 billion in net inflows from Monday through Thursday, including $297.6 million on Monday, $189.3 million on Tuesday, and a $606 million inflow on Thursday, the largest single day since May.
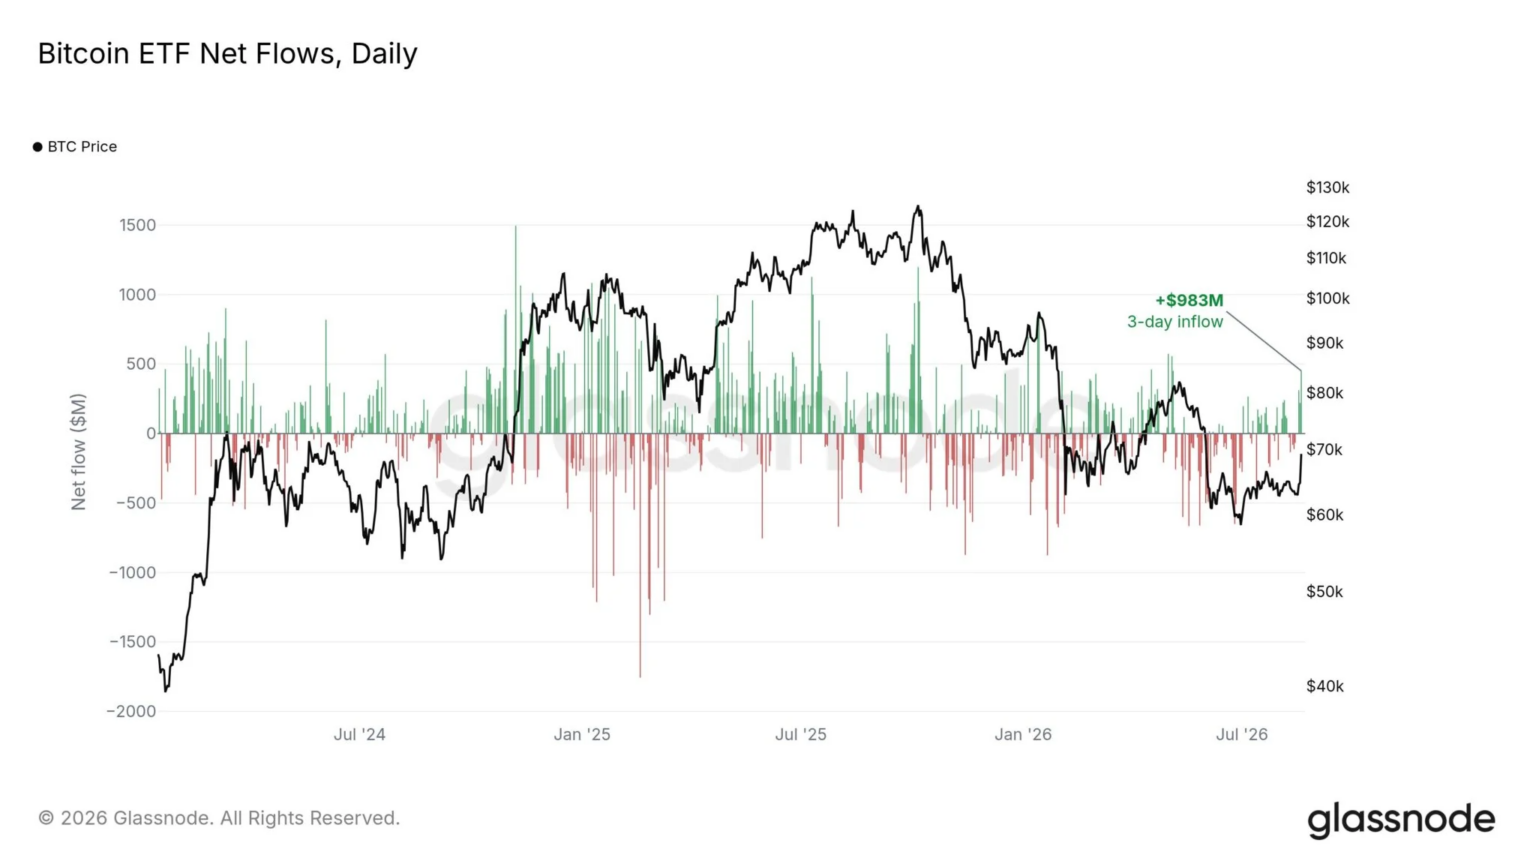
These flows represent actual buying pressure on the underlying market through fund creation activity, giving this rally a demand base broader than short covering alone, even as spot price action showed real volatility around the $80,000 resistance zone.
Bernstein’s Long-Term Bitcoin Targets
Bernstein analysts led by Gautam Chhugani laid out a multi-year Bitcoin price trajectory in a recent client note.
Under their base case, Bernstein projects Bitcoin reaching $125,000 by the end of 2026, a fresh high of $150,000 by mid-2027, a cycle peak near $300,000 in 2029, and $1 million by the end of 2033.
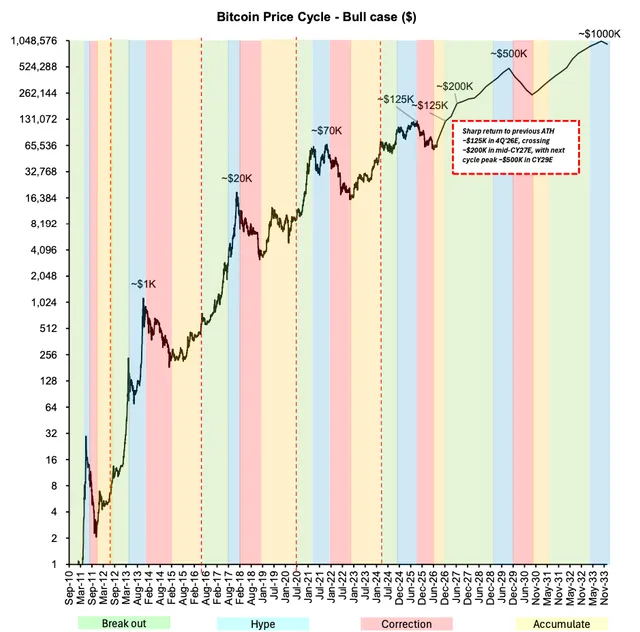
Under a more aggressive adoption scenario, where institutional capital flows in faster than currently expected, Bernstein sees Bitcoin reaching $200,000 by mid-2027 with a potential peak of $500,000 in 2029.
Bernstein’s framework values Bitcoin relative to its marginal production cost and assumes the asset continues tracking its historical four-year market cycle.
The firm’s core macro thesis centers on what it describes as the end of four decades of declining interest rates, arguing that with US government debt surpassing $40 trillion, policymakers are more likely to lean on monetary devaluation than strict fiscal discipline, a shift Bernstein believes increases demand for finite assets like Bitcoin. Our earlier coverage of the debasement trade across gold, silver, and Bitcoin covers this same broader macro narrative in more depth.
Bernstein also pointed to on-chain data showing roughly 59% of Bitcoin’s circulating supply has remained dormant over the trailing twelve months, and noted that Bitcoin’s roughly 50% drawdown from its October 2025 high has been comparatively contained relative to past cycles, attributing that resilience to spot ETF participation and corporate treasury accumulation rather than retail-driven volatility alone.
Bottomline
Bitcoin’s immediate technical test remains the $80,000 to $83,000 zone, the upper boundary of its recent trading range. A sustained close above $83,000 would weaken the bearish technical case Patel outlined, while a failure to reclaim that level keeps attention on lower support near $75,000 to $76,000 and, further below, the $55,000 to $50,000 zone some technical analysts have flagged as a downside scenario.
Traders are also watching whether the seven-session ETF inflow streak continues, and whether coin-denominated open interest stays subdued or starts climbing again as a signal of renewed leveraged risk-taking.
This article is for informational purposes only and does not constitute financial advice. Crypto price predictions are based on analyst estimates and are not guarantees of future performance. Do your own research before making any investment decisions.
Frequently Asked Questions
Need a refresher? Here are the questions traders are asking about Bitcoin this week.
Are Bernstein’s Bitcoin price targets a guarantee?
No. These figures represent Bernstein’s own analytical projections based on a specific macro thesis about interest rates and government debt, not a confirmed outcome or a market consensus. Treat them as one firm’s view among many, not a settled forecast.
Can Bitcoin holders exchange their coins for ETF shares without paying taxes?
Not as a general rule. BlackRock’s own prospectus describes cash and in-kind creation and redemption procedures that occur through named authorized participants, not direct retail conversions, and actual tax outcomes depend on the specific transaction structure and an individual investor’s own circumstances.
Why did coin-denominated open interest fall while the price rose?
Santiment data showed the number of Bitcoin tied up in outstanding futures positions declined even as the price climbed, meaning existing positions became more valuable rather than a wave of new leveraged bets entering the market.
What would confirm or invalidate the current bearish technical case?
A sustained close above $83,000 would weaken the bearish scenario, while a failure to reclaim that resistance keeps a decline toward $55,000 to $50,000 on the table as one possible outcome.
How significant is the current spot Bitcoin ETF inflow streak?
The streak reached seven consecutive trading sessions through August 25, with a $606 million single-day inflow on Thursday marking the largest since May. Sustained inflows at this pace would support the case that institutional demand, not just short covering, is driving this rally.