XRP traded near $1.00 on August 17, 2026, with social media sentiment about the token at its most negative reading in three months even as futures traders on major exchanges leaned heavily toward betting on a rebound.
Sentiment Has Reached a Three-Month Bearish Extreme
Negative commentary about XRP across X, Reddit, and Telegram hit its highest reading since mid-May, according to onchain analytics firm Santiment, as the token failed to rally through the past week.
XRP has fallen from $1.08 to $1.00 over the past thirty days, a 7.8% decline, compared to Bitcoin’s 0.5% dip and Ethereum’s 3.2% gain over the same stretch, making XRP the weakest of the three by a wide margin.
Traders watch sentiment extremes like this because of what they imply about remaining sell pressure. When nearly everyone has already turned bearish, the reasoning goes, most people who wanted to sell have likely already done so, leaving less supply to weigh on any recovery attempt.
XRPL’s “Activity Spike” Is Less Meaningful Than It Looks
XRP Ledger (XRPL) activity climbed to its highest level in more than two months on August 14, with nearly 50,000 active addresses recorded in a single 24-hour span, after activity had slid to its lowest point of 2026 back in early July.
On the surface, that looks like rising genuine usage. However, of the 1.39 million transactions processed on August 11, 928,521 were offers, orders placed on the ledger’s built-in exchange, against just 301,226 actual payments, meaning roughly two-thirds of that day’s traffic came from market-making bots posting and canceling orders rather than people sending XRP anywhere.
By August 16, total transactions had fallen to 890,743, and the ratio flipped, with 374,536 payments outpacing 322,070 offers. Since most real buying happens inside an exchange’s own order book without ever touching the ledger directly, a quiet chain can look identical whether investors are accumulating or doing nothing at all.
Futures Positioning Shows Bulls Leaning In, But Unevenly
Futures open interest climbed to roughly $2.77 to $2.78 billion on Monday, up about 2% over 24 hours, with trading volume jumping 55% to around $1.17 billion, according to CoinGlass data.
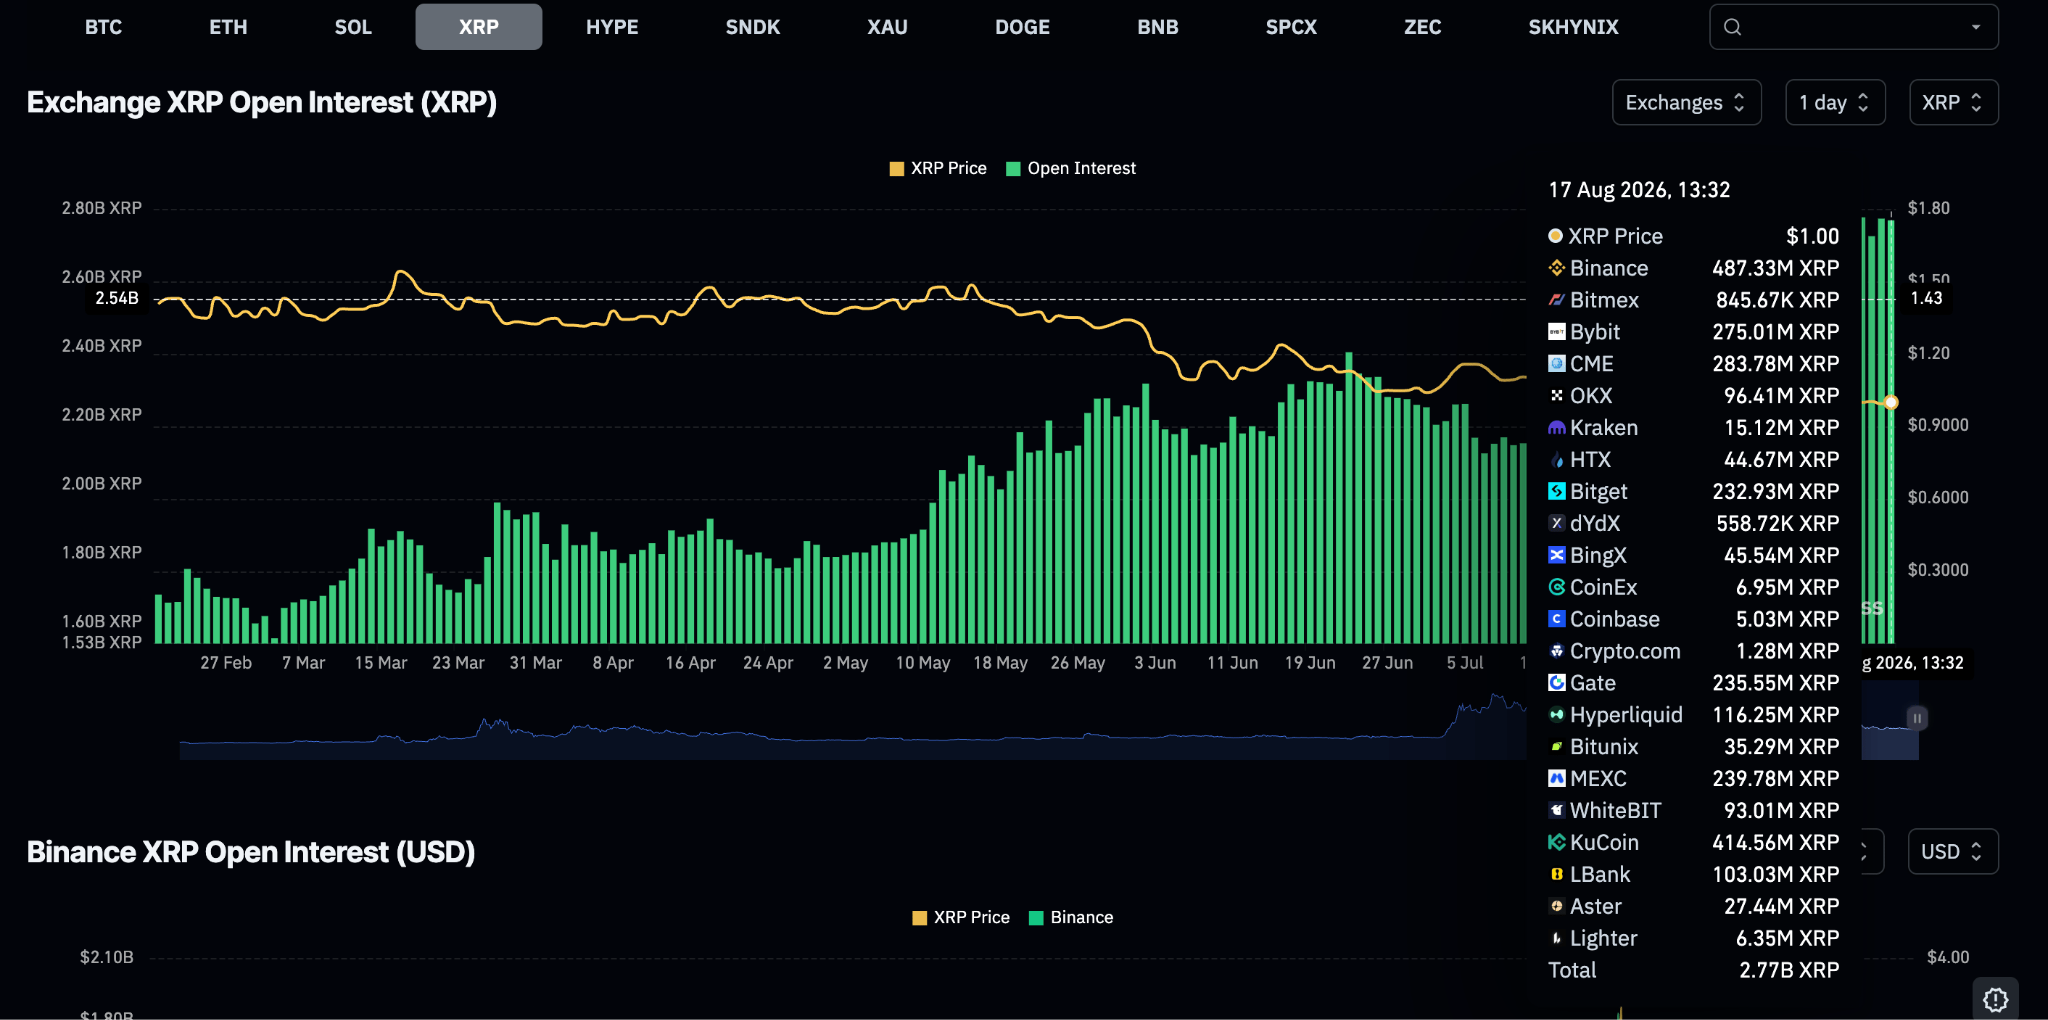
In token terms, about 2.77 billion XRP now sits in outstanding futures positions, up from closer to 2 billion earlier this summer.
The positioning itself is notably skewed, but concentrated in specific places. On Binance, more than three accounts held long XRP positions for every one holding a short, with the ratio among the exchange’s largest traders at about 3.6 to one. OKX showed the identical 3.6-to-one split. That heavy long bias, however, sits specifically on these two exchanges and their bigger accounts.
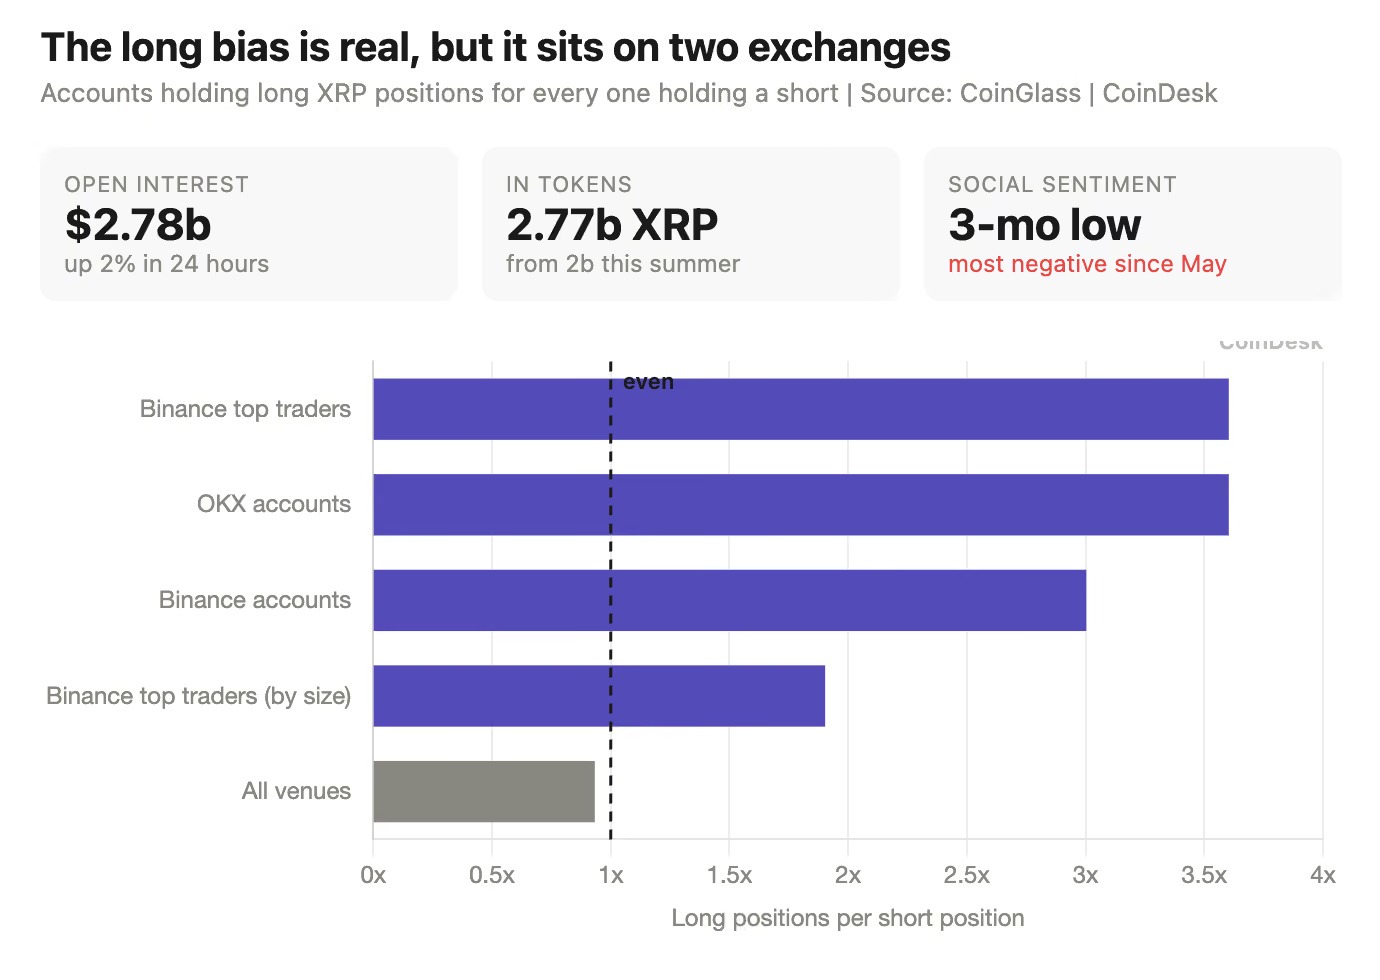
Measured across all venues, CoinGlass data puts the long-to-short ratio at about 0.93, close to balanced, meaning the aggressive bullish positioning is concentrated rather than reflecting the broader market.
This is worth keeping an eye on if XRP breaks below $1, as leveraged long positions that run out of collateral get automatically closed by exchanges, adding selling pressure to the market.
ETF Flows Are Still Modest
US spot XRP ETFs recorded about $2.25 million in net inflows last week according to SoSoValue data, marking a fifth consecutive week of positive flows even as Bitcoin and Ethereum investment products saw net outflows over the same period.
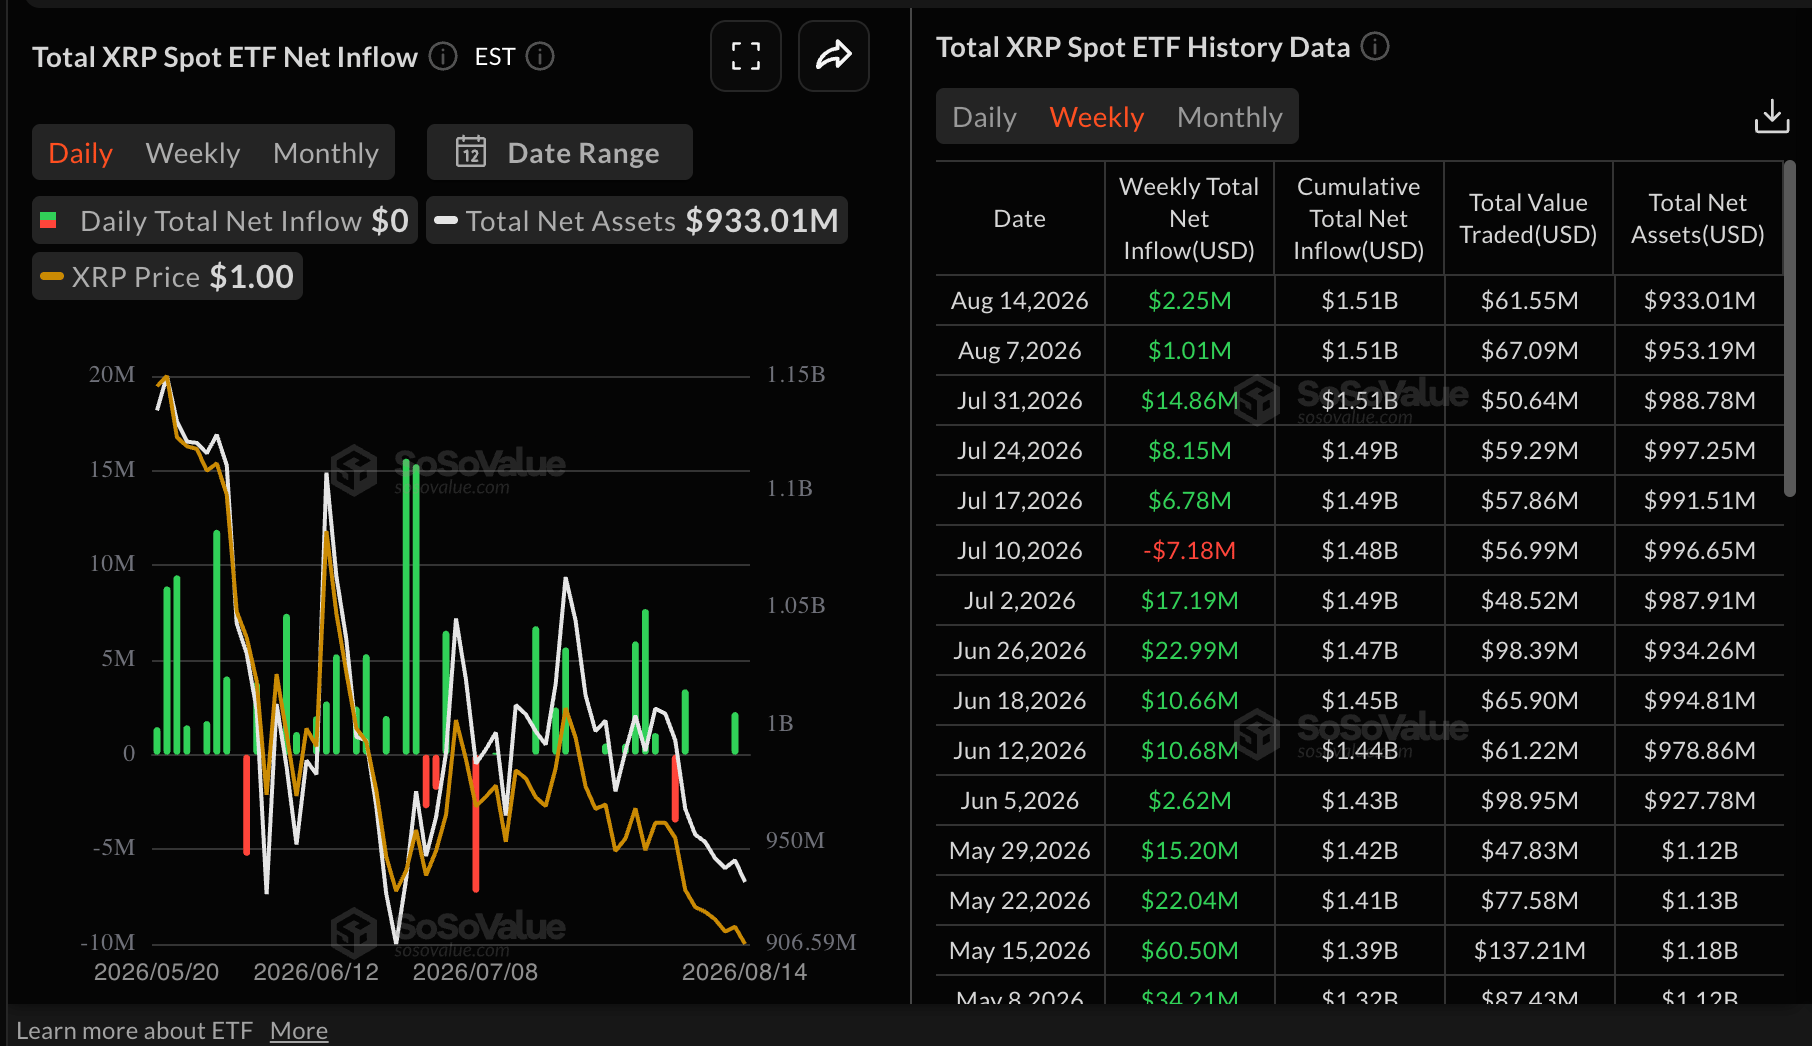
However, the scale remains small as XRP ETFs took in just $3.27 million across the first ten trading days of August, compared to $27.29 million for all of July, itself already down sharply from the $666.61 million the funds gathered in their first month after launching in November 2025, a decline of roughly 96% from that initial pace.
July alone saw zero net flows on 10 of its 17 trading days. Cumulative inflows since launch total about $1.51 billion, with the funds holding roughly $933 million in assets today, meaning anyone who bought in near the top of that cumulative figure is currently sitting on a loss.
Key Technical Levels for XRP
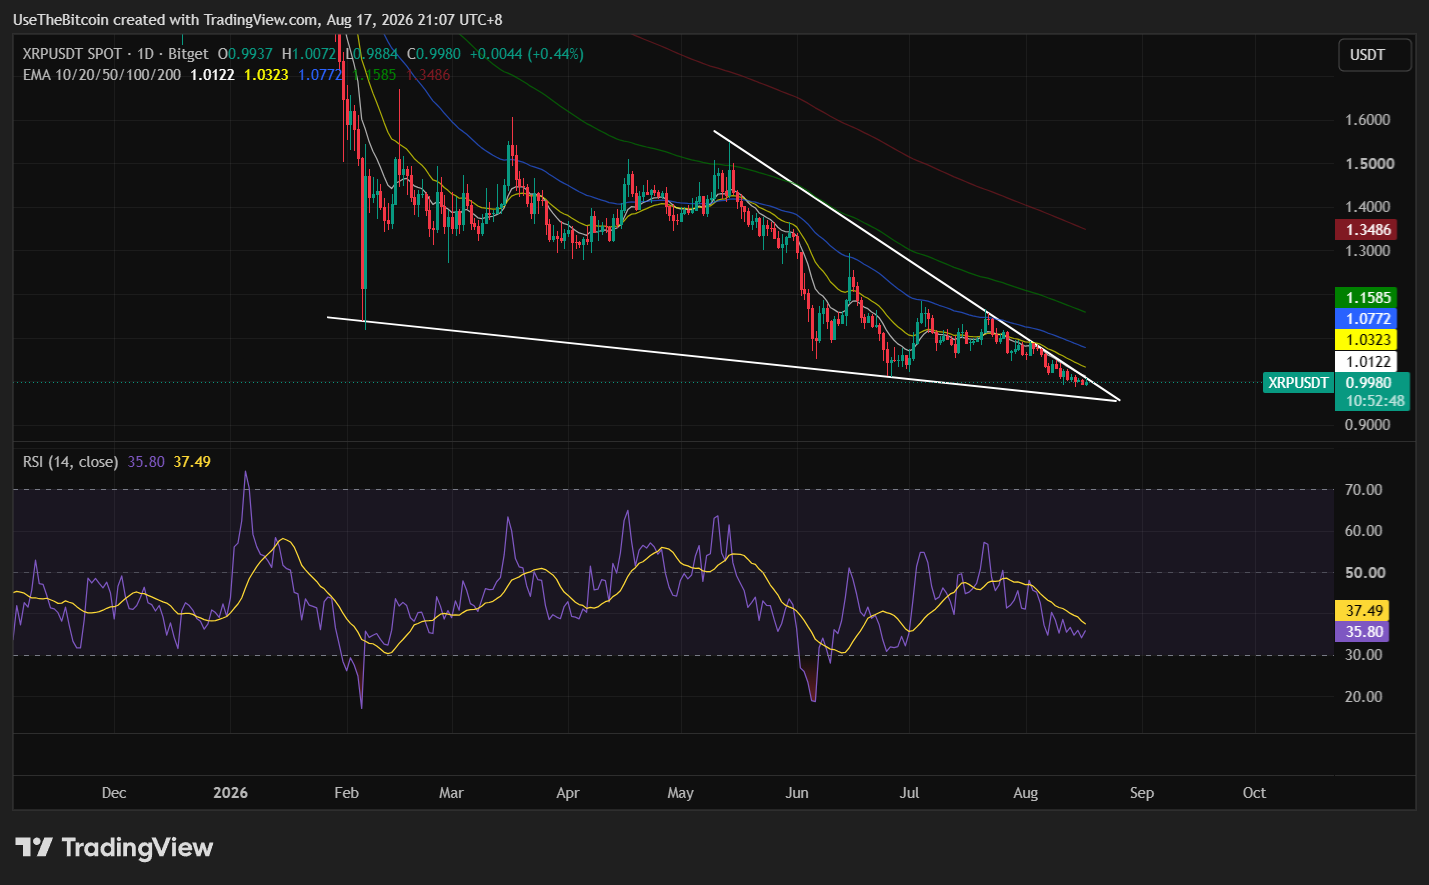
XRP has traded between two clear boundaries since June. The $1.00 to $1.05 band has held as support on every test, while each recovery attempt in June, July, and August has stalled between $1.09 and $1.10. RSI sits around 35.80 on the daily chart, below the neutral 50 level, suggesting sellers still hold control of near-term momentum.
| Level | Role | Notes |
| $1.00-$1.05 | Support band | Held on every test since June |
| $1.07 | Main resistance | Near-term supply level |
| $1.08 | 50-day EMA | Just above the main resistance |
| $1.09-$1.10 | Recovery ceiling | Has capped every rally attempt since June |
| $1.16 | 100-day EMA | Stronger resistance layer above current price |
| $1.35 | 200-day EMA | Marks the broader downtrend structure |
| $1.55 | Descending trendline origin | Defines the longer-term bearish backdrop |
What Would Change This Picture
Extreme negativity has marked genuine bottoms for XRP before, but historically only when buyers were already stepping in underneath the price at the same time.
Nothing in the current data shows that happening yet, which is why this round of pessimism doesn’t clearly mark a floor on its own.
Two specific developments would change that read. First, four consecutive weeks of ETF inflows above $10 million would signal institutional money returning at scale, and a sustained move above $1.10 would clear the level that has capped every rally attempt since June.
Beyond those, the Senate’s cloture vote on the CLARITY Act, scheduled for September 15, remains the only major catalyst on the calendar, and passage would classify XRP as a commodity under federal law, the regulatory outcome institutional buyers have reportedly been waiting on. Our XRP price analysis from last week tracks how this same setup has evolved over the past week.
Bottom Line
XRP’s current setup is split between three different signals pointing in different directions. Sentiment is at its most bearish in three months, whale behavior suggests holding rather than distribution, and futures traders on major exchanges are leaning heavily long, even though that bias is concentrated rather than market-wide.
None of these signals alone is enough to call a bottom, and the modest scale of ETF inflows relative to launch suggests institutional conviction has not yet caught up to the more bullish positioning seen in derivatives markets specifically.
This article is for informational purposes only and does not constitute financial advice. Crypto price predictions are based on analyst estimates and are not guarantees of future performance. Do your own research before making any investment decisions.
Frequently Asked Questions
Need a refresher? Here are the questions traders are asking about XRP this week.
Is XRP’s negative sentiment a buy signal right now?
Not clearly, based on the available data. Extreme negativity has preceded past XRP bottoms, but only when buyers were already stepping in underneath the price at the same time. That accumulation pattern is not visible in the current data, so the current pessimism does not yet meet the historical conditions for a confirmed bottom.
Why is XRP Ledger activity rising if the price isn’t moving?
Much of the recent activity spike came from market-making bots posting and canceling exchange orders rather than genuine payment transfers.
Are XRP futures traders bullish or bearish right now?
It depends on where you look. Binance and OKX show a heavy long bias among their largest traders, at roughly 3.6 to 1. Measured across all trading venues, however, the long-to-short ratio sits close to balanced, meaning the bullish positioning is concentrated on specific exchanges rather than reflecting the broader market.
How much money has flowed into XRP ETFs recently?
About $2.25 million last week, marking a fifth straight week of positive flows, though the pace remains far below the $666.61 million the funds attracted in their first month after launching in November 2025. Cumulative inflows since launch total roughly $1.51 billion, with the funds now holding about $933 million in assets.
What would confirm a real XRP recovery is underway?
Two specific developments would strengthen the case. Four consecutive weeks of ETF inflows above $10 million would signal institutional demand returning at scale, and a sustained break above $1.10 would clear the resistance band that has capped every rally attempt since June.