
Bitcoin surged past $72,000 this week, its highest level since early June, as a US Treasury policy shift, a large short squeeze, and improving regulatory expectations combined to drive one of the year’s sharpest recoveries.
What’s Driving The Bitcoin and Crypto Market Rally
The August 2026 Bitcoin and crypto rally was driven by the US Treasury’s August 19 plan to at least double its long-term bond buybacks, which eased pressure on yields, and by a short squeeze: liquidations topped $3.3 billion, about $3.1 billion of it in shorts, per CoinGlass. Bloomberg also reported $2.9 billion of whale accumulation over 60 days.
The clearest macro catalyst traces back to the US Treasury, which announced on August 19 that it will at least double the scale of its liquidity-support buyback operations for 10- to 30-year Treasuries, raising the maximum limit per operation from $2 billion to at least $4 billion, with implementation starting September 9.
That move eased upward pressure on long-term Treasury yields, which had been climbing due to an expanding fiscal deficit and rising financing demand from tech companies building AI data centers.
As yields and the dollar weakened, the broader valuation and liquidity environment for risk assets improved, providing real support for Bitcoin specifically.
Moreover, a large short squeeze did much of the immediate work, with total liquidations across the crypto market exceeding $3.3 billion, including roughly $3.1 billion in short positions specifically, according to CoinGlass data.
Separately, Bloomberg reported that Bitcoin whales ended a recent selling spree and added $2.9 billion in accumulation over the past 60 days, a distinct, longer-horizon data point from the short-term liquidation figures, and one that suggests real capital sits behind this move rather than only leveraged positions unwinding.
Sentiment and the Broader Market Backdrop
The Fear and Greed Index jumped 16 points to 62, squarely in greed territory, up from 46 just a day earlier, according to crypto analytics firm Alternative.
Total crypto market capitalization is also sitting near $2.46 trillion, with Bitcoin’s dominance at roughly 59.5%, suggesting this rally is specifically Bitcoin-led rather than a broad, even move across the market.
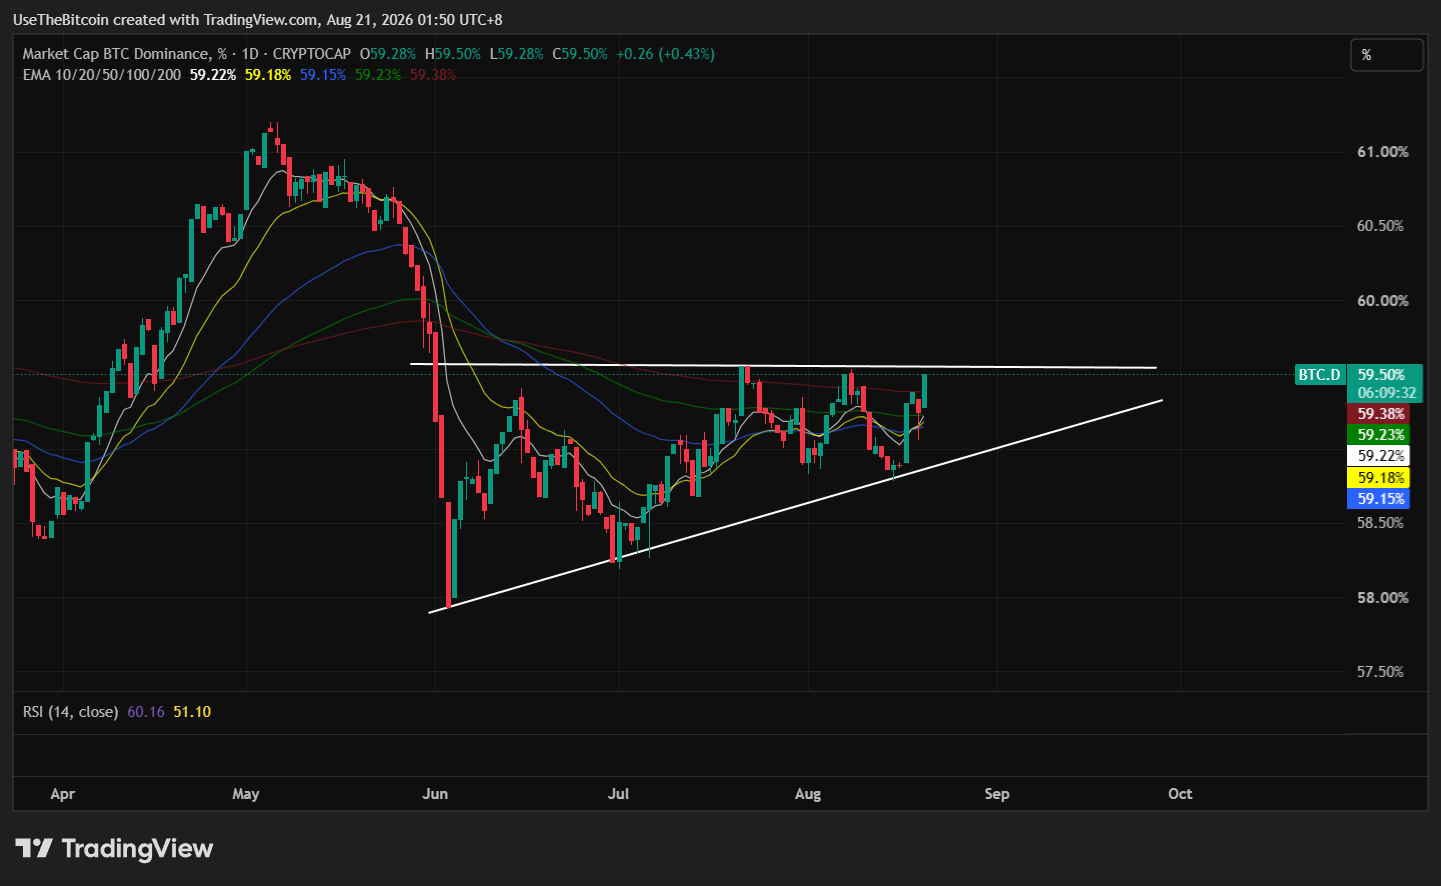
Bitcoin has clawed back from below $64,000, flirting near $75,000 in under two weeks, a fast reversal that shows how quickly sentiment can flip once macro tailwinds line up.
The Technical Picture, Read Three Different Ways
Traders are currently watching for different price levels for Bitcoin, with different angles of technical analysis relative to the same price action.
Using trendline and round-number analysis, Bitcoin has moved decisively above a long-term descending trendline and the former $66.5K resistance zone, which now functions as support.
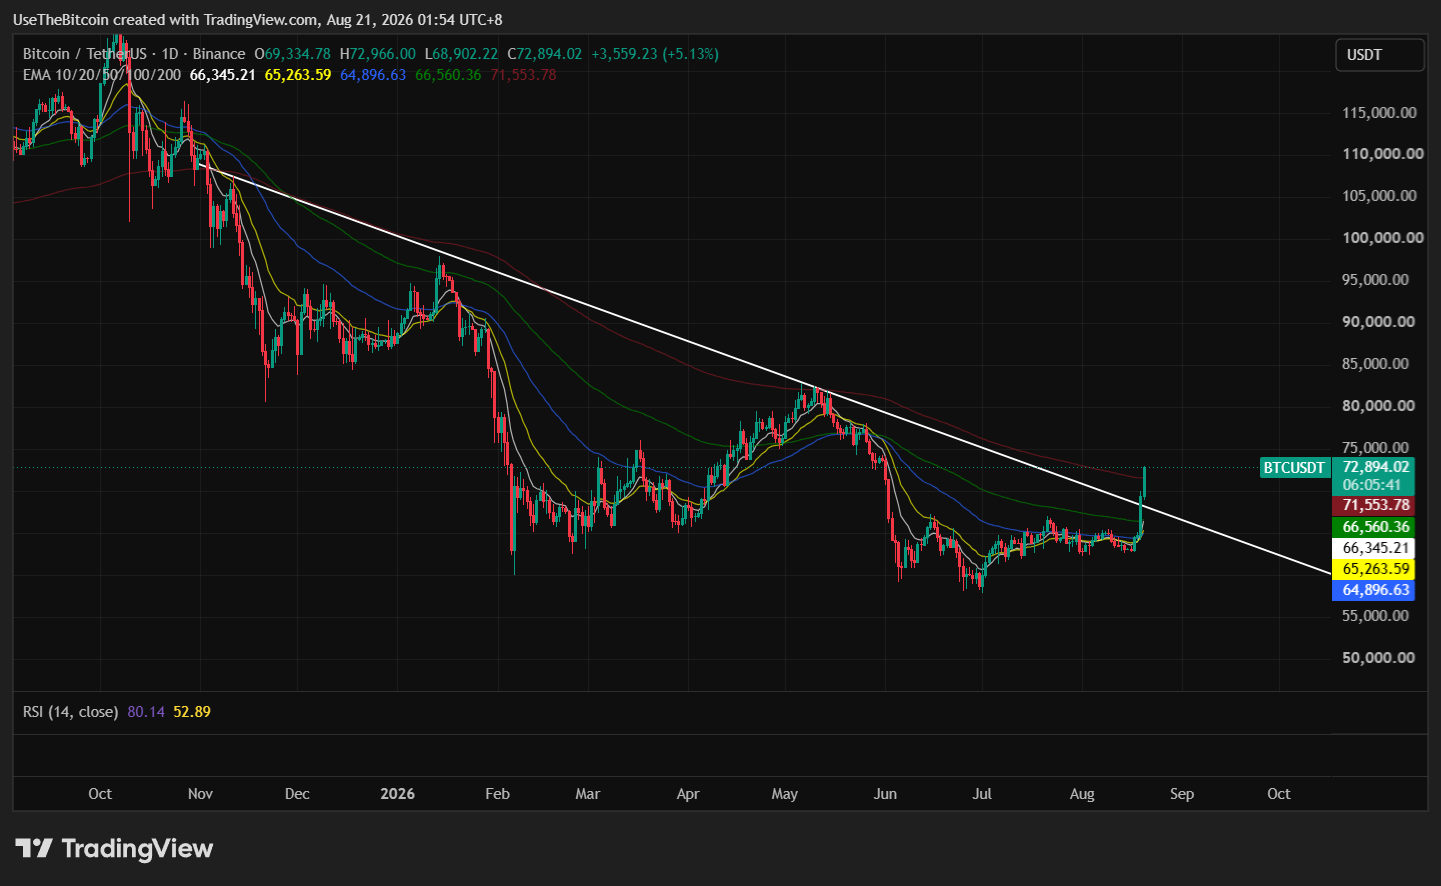
The next resistance sits at $72K to $74K, with a further zone at $80K to $82K if that clears.
On the four-hour chart, the $66K to $67K zone is the key short-term pivot, with the breakout structure staying intact as long as price holds above it.
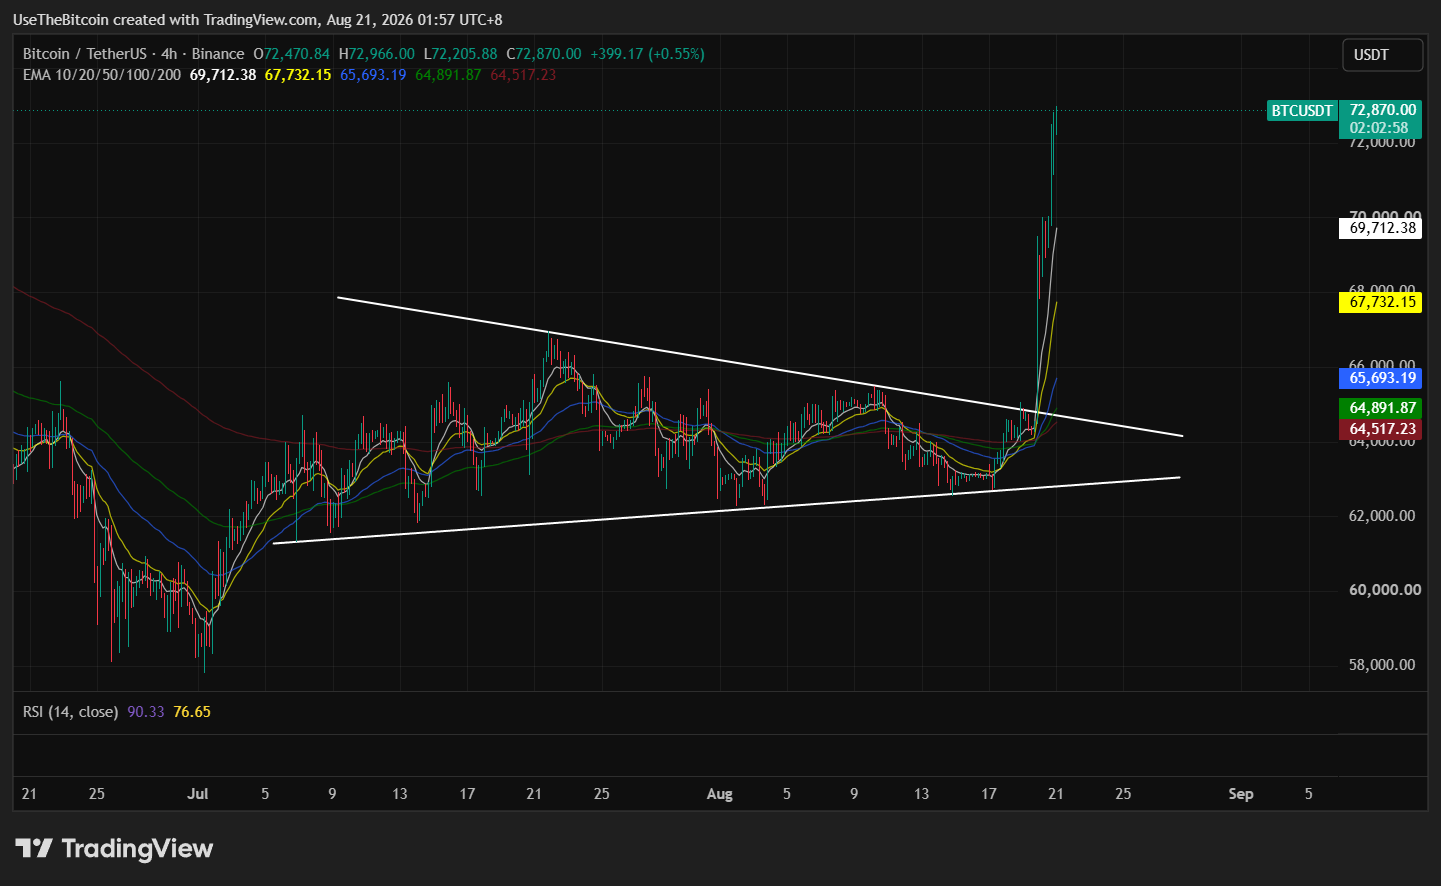
Using EMA and pivot-point analysis, the daily chart shows Bitcoin trading between the pivot at roughly $70,434 and the first resistance at roughly $71,966, a range that overlaps closely with the daily EMA200 near $71,711, the specific cluster analysts are watching as the real battleground.
A confirmed daily close above both the EMA200 and the first resistance would flip the daily trend from neutral to confirmed bullish.
On the downside, the 1-hour EMA20 near $68,737 and the daily pivot near $70,434 are the levels most likely to matter first if momentum fades.
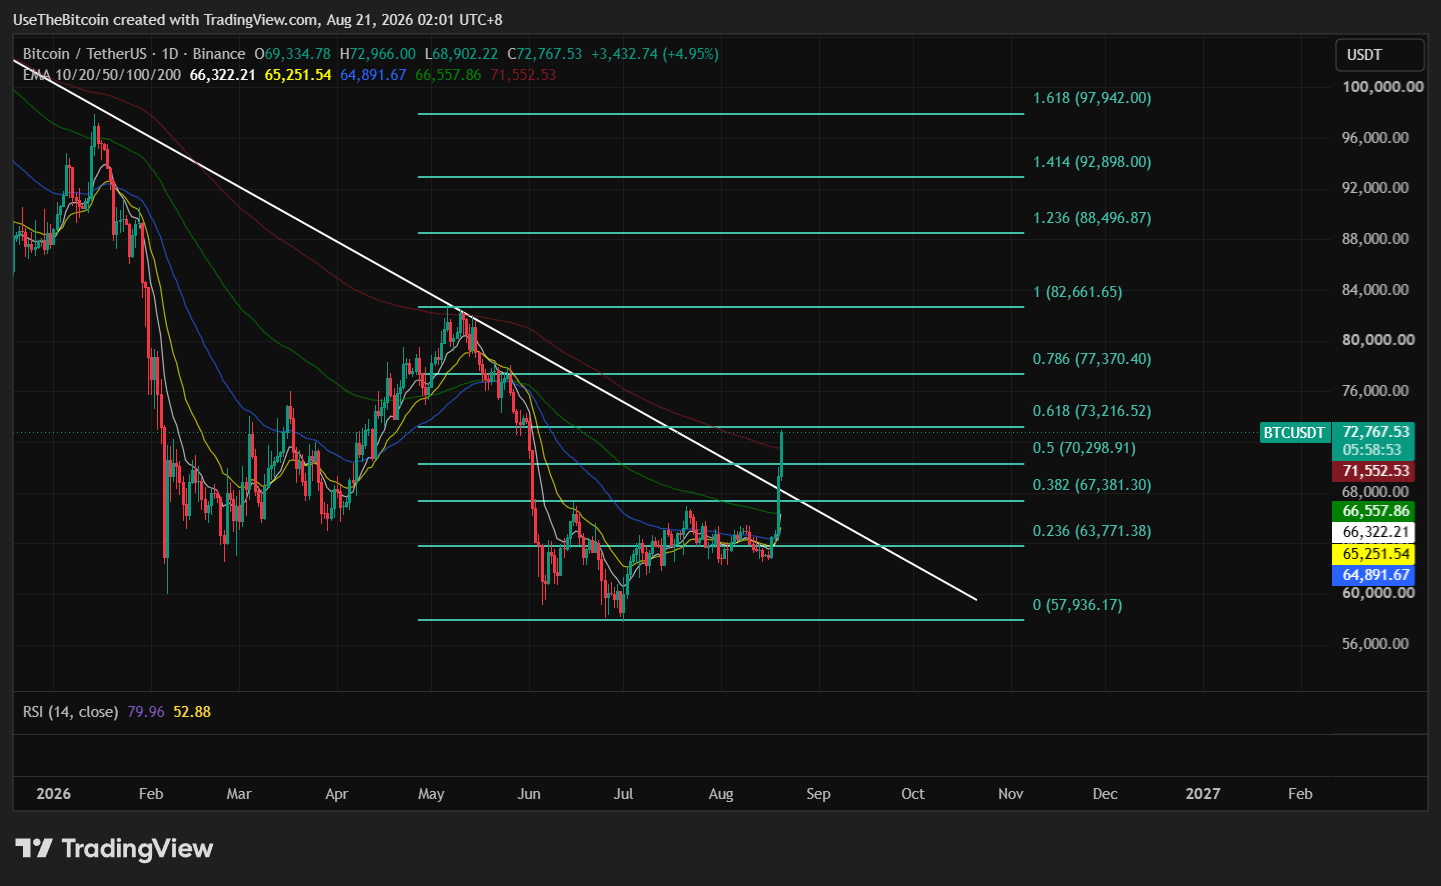
Using Fibonacci retracement analysis, Bitcoin has reclaimed its 0.5 retracement level at $70.2K, which now functions as the primary support, with the 0.618 retracement level at $73K serving as the key overhead resistance that would need to clear and hold for this move to shift from a technical recovery into a confirmed trend reversal.
| Level | Role | Notes |
| $60,000 | Trendline analysis | Prior major demand zone |
| $66,000 – $67,000 | Trendline analysis | Key four-hour pivot |
| $66,500 | Trendline analysis | Former resistance, now support |
| $68,737 | EMA/pivot analysis | 1-hour EMA20, first downside level to watch |
| $70,266 | Fibonacci analysis | 0.5 retracement, primary support |
| $70,434 | EMA/pivot analysis | Daily pivot point |
| $71,711 | EMA/pivot analysis | Daily EMA200, key overhead cluster |
| $71,966 | EMA/pivot analysis | Daily R1 resistance |
| $72,000 – $74,000 | Trendline analysis | Next resistance zone |
| $73,227 | Fibonacci analysis | 0.618 retracement, key confirmation level |
| $80,000 – $82,000 | Trendline analysis | Further resistance if $74K clears |
What On-Chain Order Flow Suggests
Separate from the price charts, futures order-flow data offers another angle on who’s driving this move.
Breaking activity into normal, large whale, small whale, and retail order sizes shows the recent recovery from $60K toward $70K featuring a consistent mix of normal and whale-sized orders, rather than the retail-dominated order clusters visible during some earlier rallies and their subsequent declines.
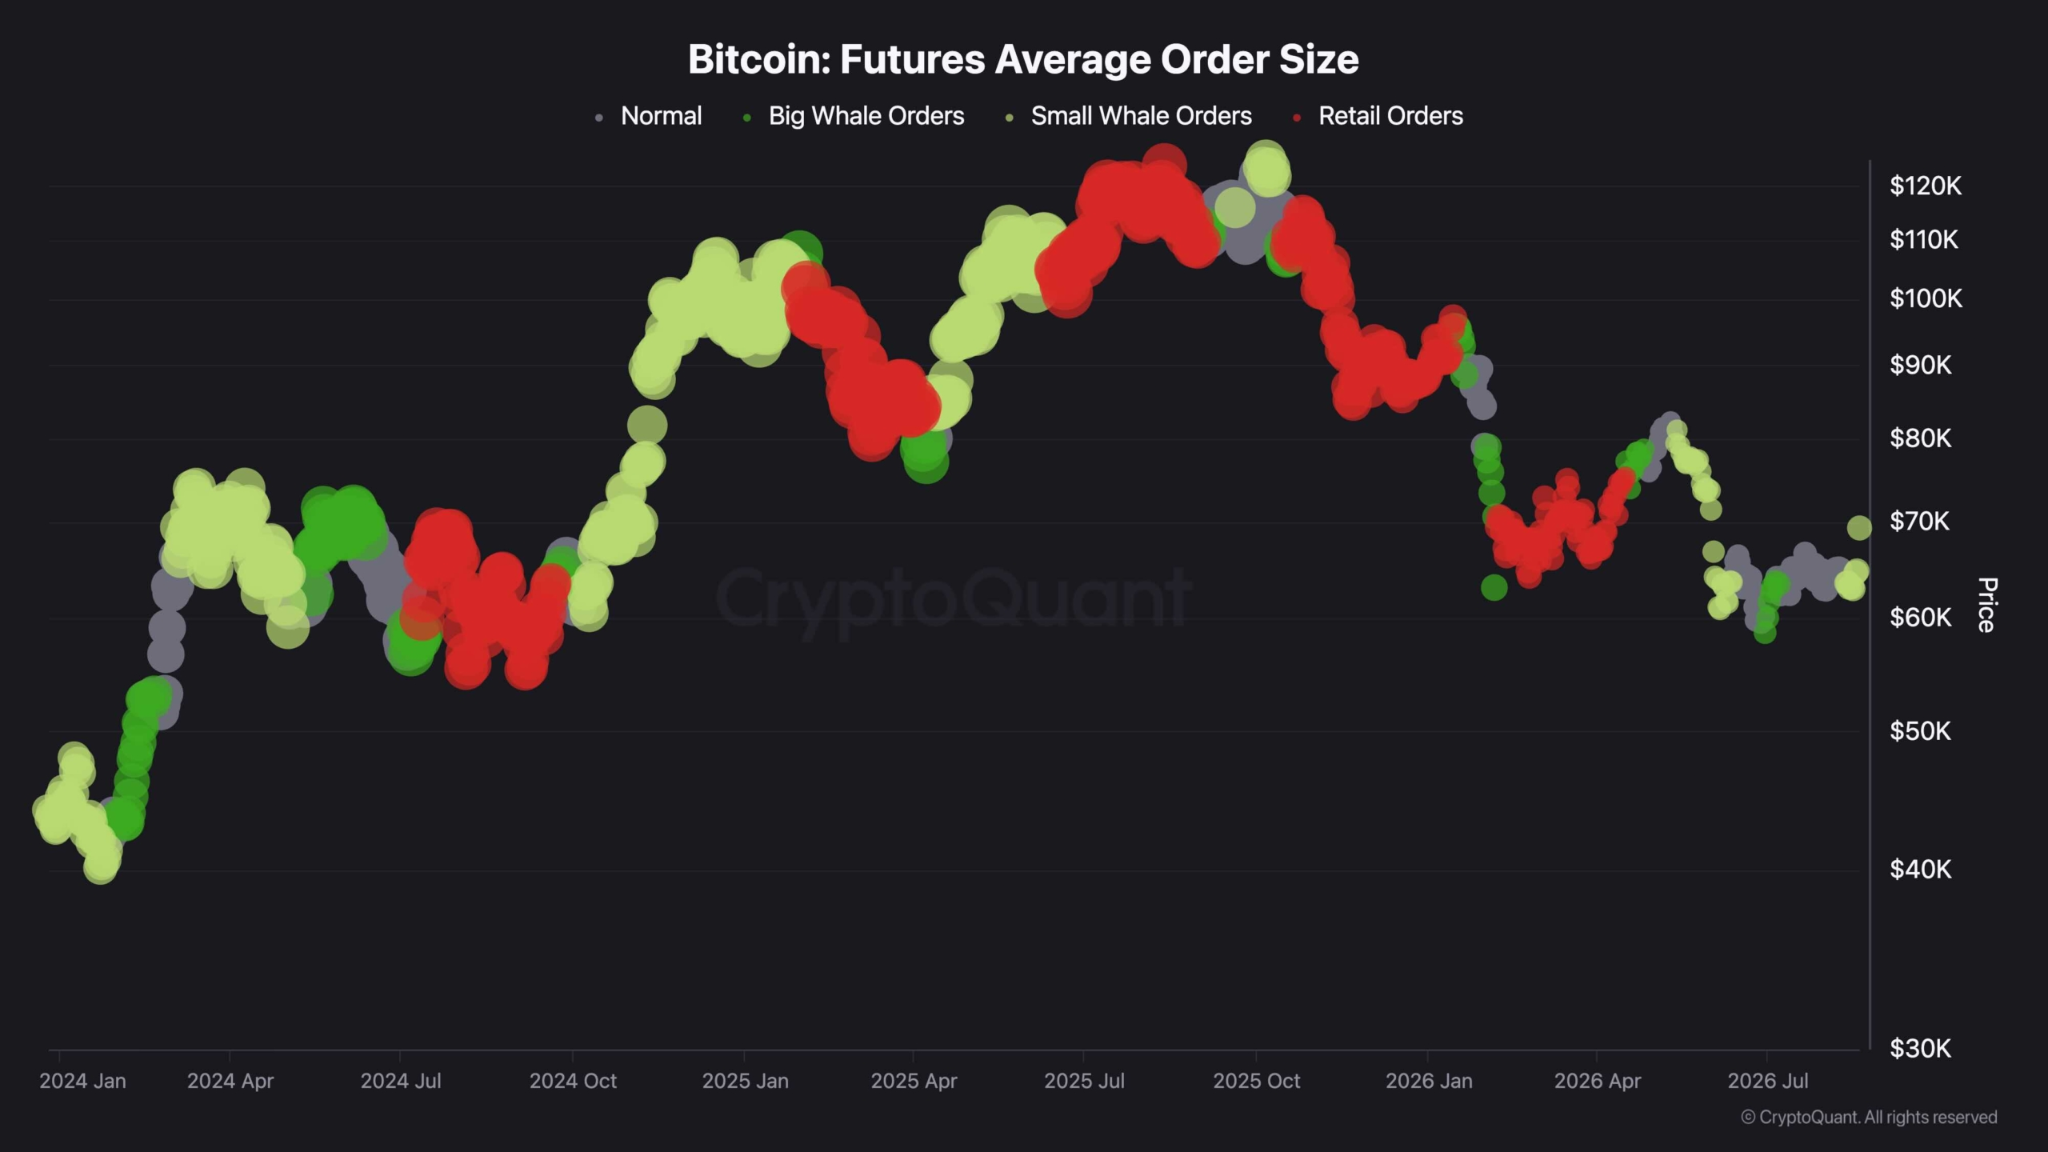
That’s a constructive sign for the durability of this move, though the data itself cannot confirm whether those larger orders are predominantly long or short, only that bigger participants are actively involved rather than sitting this one out.
Bottom Line
This rally rests on a combination of factors rather than any single driver: a macro shift from Treasury buybacks easing yield pressure, a large, confirmed short squeeze, renewed whale accumulation over a longer 60-day window, and improving regulatory sentiment tied to the CLARITY Act.
Every timeframe examined here shows stretched, overbought momentum, which historically precedes at least a pause rather than a clean, uninterrupted continuation.
The clearest signal from here isn’t any single indicator but whether Bitcoin’s next daily close lands above the roughly $71,700 to $72,000 resistance cluster where trendline, EMA, and Fibonacci frameworks all converge, or fails there and opens the door back toward the $70,000 to $70,300 support band most of these same frameworks agree on.
Given how fast this reversal happened, from below $64,000 to touching $72,000 in under two weeks, the coming days matter more than usual for confirming whether this becomes a durable trend shift or settles into a wider, choppier range while the market digests the move.
This article is for informational purposes only and does not constitute financial advice. Crypto price predictions are based on analyst estimates and are not guarantees of future performance. Do your own research before making any investment decisions.
Frequently Asked Questions
Need a refresher? Here are the questions traders are asking about Bitcoin this week.
Why is Bitcoin’s rally being called a short squeeze?
Total liquidations across the crypto market exceeded $3.3 billion over 24 hours, with roughly $3 billion coming from short positions specifically, according to CoinGlass data. That kind of forced buying from short sellers being liquidated can accelerate a rally beyond what organic spot demand alone would produce.
Are whales buying Bitcoin again?
Yes, based on the data reviewed here. Bloomberg reported that Bitcoin whales ended a recent selling spree and added $2.9 billion in accumulation over the past 60 days, a separate and longer-term data point from the short-term liquidation activity driving the immediate price move.
What is the single most important resistance level to watch?
The zone between roughly $71,700 and $72,000 is where the daily EMA200, the first resistance pivot point, and the round $72,000 level all cluster closely together across different technical frameworks, making it the most closely watched confirmation point for whether this move becomes a confirmed trend reversal.
How did US Treasury policy affect Bitcoin’s price?
The Treasury’s August 19 announcement to at least double its long-term bond buyback operations eased upward pressure on Treasury yields, which had been climbing due to fiscal deficit concerns and AI-related financing demand. Lower yields and a weaker dollar generally improve the environment for risk assets like Bitcoin.
Is this rally sustainable, or just a short-term squeeze?
That remains unresolved. If spot buying and ETF inflows cannot sustain the move once short covering concludes, the rally risks transitioning into high-volatility consolidation rather than a confirmed structural trend change, which is why the next daily close relative to the resistance cluster matters more than the size of the initial breakout.