
Key Takeaways
- Bitcoin fell below $83,000 on October 8 as Federal Reserve minutes reinforced expectations of another possible interest rate hike.
- Crypto markets recorded approximately $550 million in long liquidations during the initial sell-off.
- BTC must reclaim $84,200 to improve short-term momentum, while a drop to $81,000-$82,500 could expose the $78,000-$80,000 support zone.
Bitcoin slipped below $83,000 on October 8 after another failed attempt to break through $87,000, with selling pressure intensifying amid rising Treasury yields and renewed uncertainty over US interest rates.
Bitcoin’s price is extending its decline from the $86,000 to $87,000 region earlier in the week, following a broader crypto sell-off that triggered approximately $550 million in leveraged long liquidations during its initial phase.
The Federal Reserve’s September meeting minutes, which were released on October 7, added another concern as policymakers broadly anticipated further monetary tightening, although the minutes provided no definite timing for the next increase.
Bitcoin now faces a critical test between $81,000 and $83,000. Holding that area could support a recovery toward $84,200 and $86,700, while a confirmed breakdown would increase the risk of a deeper correction toward $78,000 to $80,000.
Bitcoin Falls Below $83K After Repeated $87K Rejections
Bitcoin’s latest decline followed several unsuccessful attempts to break through the $87,000 to $88,000 resistance region.
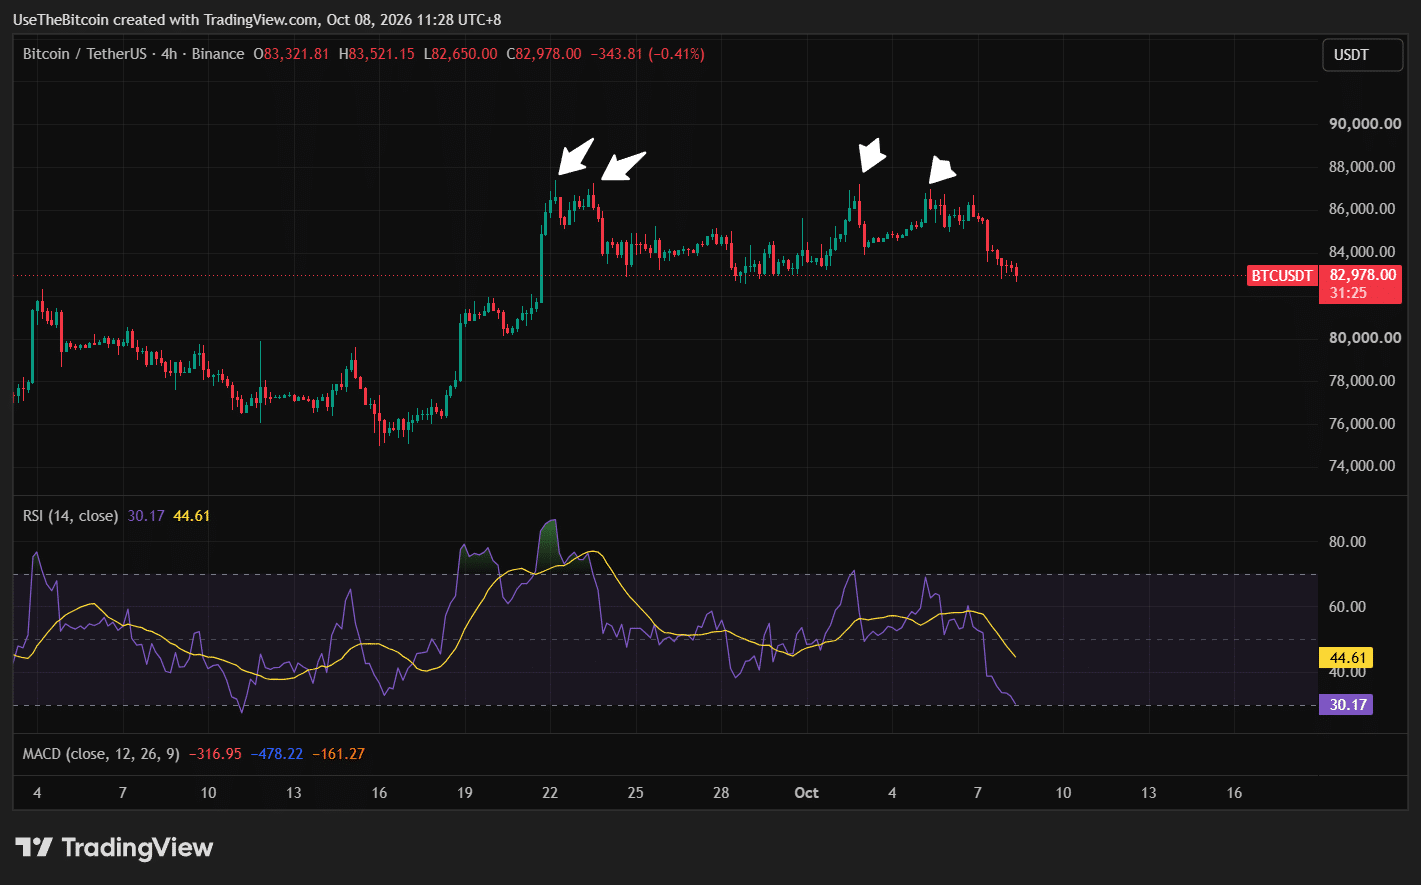
The October 7 sell-off initially pushed BTC toward $83,560, where buyers briefly stabilized prices around near $83,850.
However, subsequent selling carried Bitcoin below $83,000, and the decline has weakened Bitcoin’s short-term structure.
The immediate recovery level is now approximately $84,200, which aligns with a previously important technical midpoint. Reclaiming that level would improve the chances of another attempt toward $86,700.
A stronger breakout would still require a daily close above $87,000 to $88,000.
| Bitcoin Level | Role |
| $84,200 | Immediate recovery resistance |
| $85,500 | Secondary resistance |
| $86,700-$87,000 | Key bullish confirmation zone |
| $88,000 | Major daily resistance |
| $90,000-$92,000 | Higher upside targets |
| $82,500-$83,000 | Immediate support |
| $81,000 | Critical short-term support |
| $78,000-$80,000 | Next major demand zone |
| $75,000-$78,000 | Broader daily support |
Table 1. Bitcoin Key Support and Resistance Levels
Fed Minutes Signal Another Rate Hike Could Come This Year
The Federal Reserve’s latest meeting minutes have refocused attention on monetary policy.
Published on October 7, the minutes covered the September 15-16 meeting, when the Federal Open Market Committee (FOMC) unanimously raised its benchmark interest rate by 25 basis points to a range of 3.75% to 4.00%.
The decision marked the Fed’s first rate increase since 2023.
The minutes indicated that most officials expected another increase could be appropriate before the end of 2026 as inflation remained above the central bank’s 2% target. However, policymakers did not establish when that increase should occur.
Despite the possibility of another increase later this year, investors are not treating an October hike as certain.
Market pricing on October 8 indicated approximately an 18% probability of another rate increase at the October 27-28 meeting according to FedWatch, suggesting that holding rates steady remained the more likely immediate outcome.
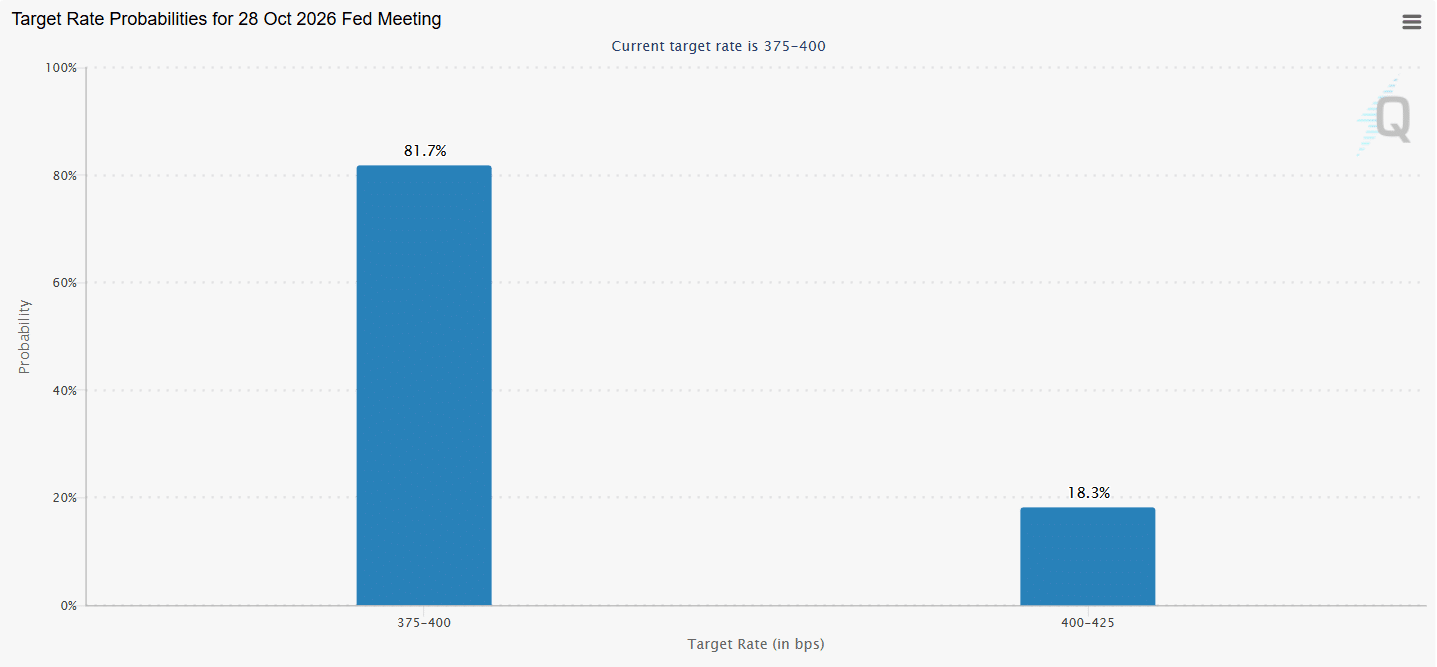
Another rate increase could reinforce elevated borrowing costs and reduce demand for risk assets. A decision to hold rates steady might provide short-term relief, but it would not necessarily mean the Fed is preparing to cut rates.
Bitcoin’s recovery remains exposed to incoming inflation data, Treasury yields, and changing expectations for the Fed’s December meeting.
Rising Treasury Yields and a Stronger Dollar Pressure Bitcoin
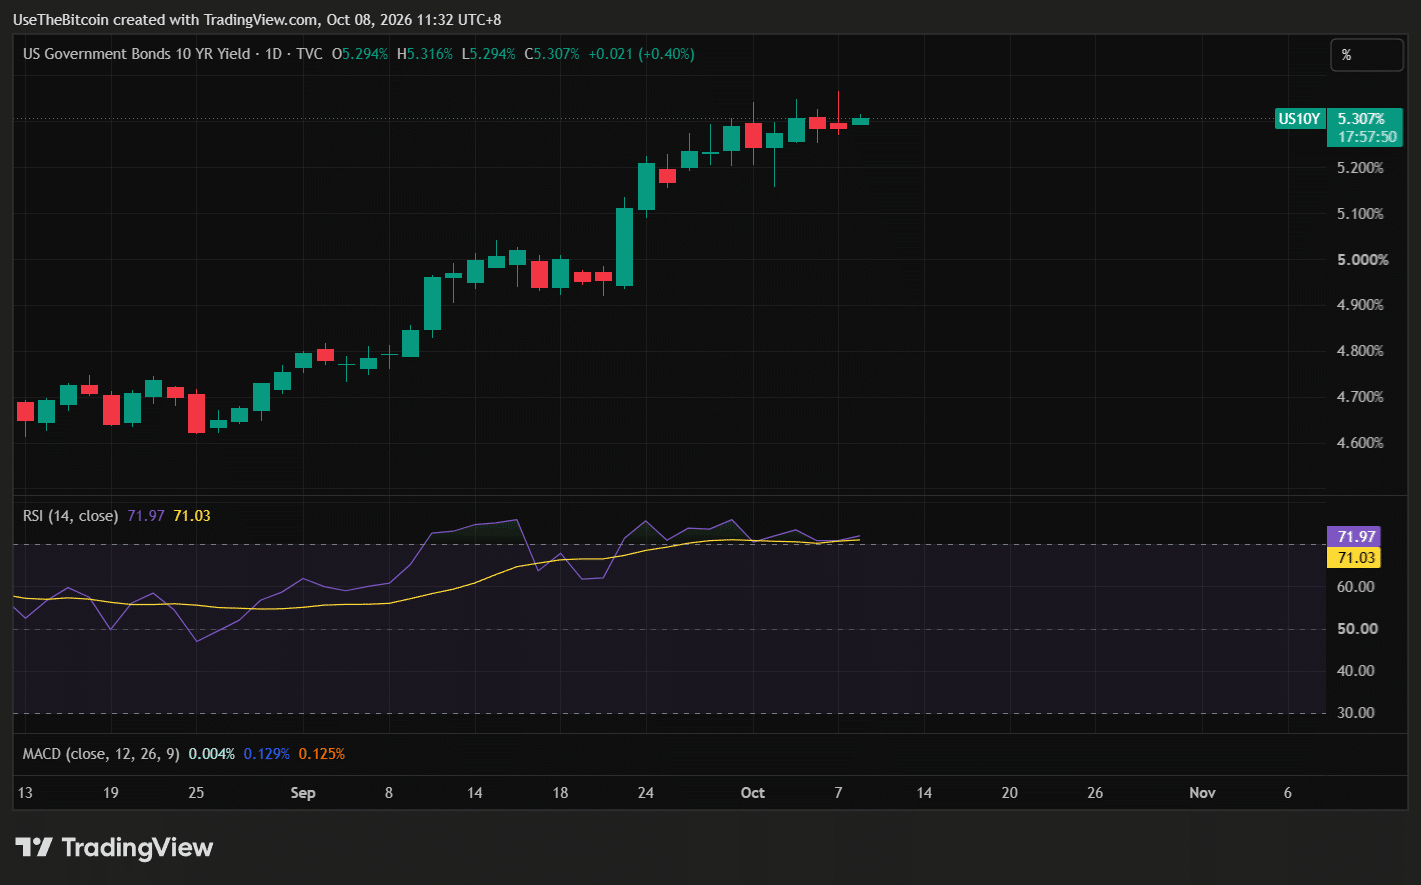
On October 7, the US 10-year Treasury yield rose toward 5.36%, while the dollar strengthened amid inflation concerns and higher energy costs.
Brent crude also climbed above $100 per barrel as geopolitical tensions threatened oil supplies.
Higher Treasury yields increase the potential returns available from government bonds, which can make non-yielding assets such as Bitcoin less attractive to some investors.
A stronger dollar can also tighten global financial conditions by increasing funding costs and reducing purchasing power for investors using other currencies.
The October 7 minutes reinforced the possibility that interest rates could remain elevated for longer.
However, Bitcoin’s sell-off had already begun before the minutes were released, so the decline should therefore not be attributed entirely to the Fed announcement.
The broader combination of rising yields, expensive oil, a stronger dollar, and leveraged liquidations had already weakened market sentiment.
Crypto Liquidations Reach $550 Million as BTC Drops
The initial decline below $84,000 triggered a significant wave of forced selling in crypto derivatives markets.
According to CoinGlass data reported during the sell-off, cumulative long liquidations reached approximately $550 million over 24 hours.
Bitcoin fell toward $83,560 as leveraged positions were closed, adding selling pressure to an already weakening market.
Subsequent reporting placed broader 24-hour crypto liquidations near $696 million as the sell-off continued, indicating that the earlier $550 million figure was not the final total for the entire decline.
Bitcoin Open Interest Rebounds After the Liquidation Wave
Open interest increased from approximately $54.2 billion to $55.3 billion over six hours on October 7.
Funding rates also stayed positive, suggesting traders kept paying to maintain long exposure even as Bitcoin weakened.
Rising open interest after heavy liquidations can indicate renewed participation, but it does not establish whether new positions are predominantly bullish or bearish.
If leveraged long exposure builds again while BTC remains below resistance, the market could face another round of forced selling.
Bitcoin ETFs Remain Important Despite the Latest Pullback
Institutional demand provides a different perspective on Bitcoin’s current weakness.
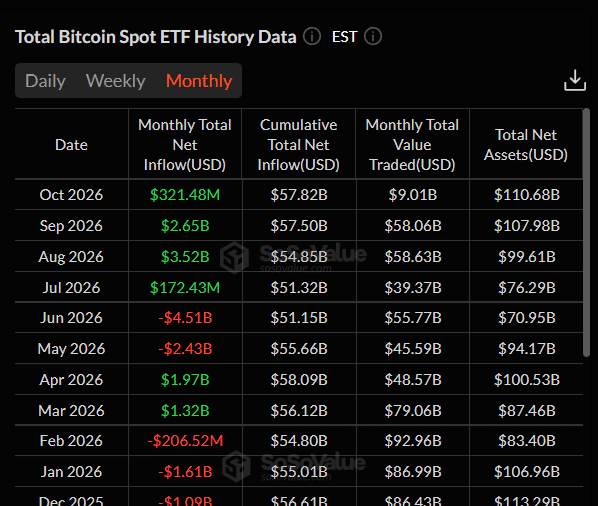
US spot Bitcoin exchange-traded funds (ETFs) attracted about $6.3 billion in net inflows in the third quarter of 2026, helping absorb selling pressure as Bitcoin recovered from its summer lows.
The inflows also help explain why Bitcoin’s current market cycle has differed from previous downturns.
Bitcoin reached an all-time high above $126,000 on October 6, 2025. One year later, BTC was approximately 32% below that peak, compared with considerably deeper declines recorded one year after several previous cycle highs.
Institutional participation, ETF demand, and lower overall leverage may have contributed to the shallower correction. However, that does not rule out another substantial decline.
Recent trading volumes across spot exchanges and ETFs have also been relatively weak, limiting the buying support available during the latest sell-off.
The next important signal will be whether ETF inflows strengthen as Bitcoin tests the $81,000 to $83,000 support region.
Earlier $46K Bitcoin Forecast Has Not Materialized
Bitcoin’s recent performance also provides a useful comparison with earlier bearish forecasts.
In June and July, 10x Research founder Markus Thielen projected that Bitcoin could fall toward $55,000 or potentially reach $46,000 to $47,000 before establishing a more durable bottom.
However, Bitcoin reached its reported 2026 low near $57,717 on June 30, then recovered toward $86,000.
The subsequent recovery was supported partly by strong ETF demand during the third quarter.
This does not rule out further downside, but the previous $46,000 target should not be treated as an active price level confirmed by current market conditions.
For the October 8 setup, the nearer $81,000 support and $78,000 to $80,000 demand region provide more useful references than revisiting an earlier forecast that has not materialized.
Can Bitcoin Hold $81K and Avoid a Deeper Correction?
Bitcoin’s immediate direction now depends on whether buyers can defend the $81,000 to $83,000 support area.
The four-hour structure has weakened after breaking below its ascending trendline, while the daily chart remains relatively stronger.
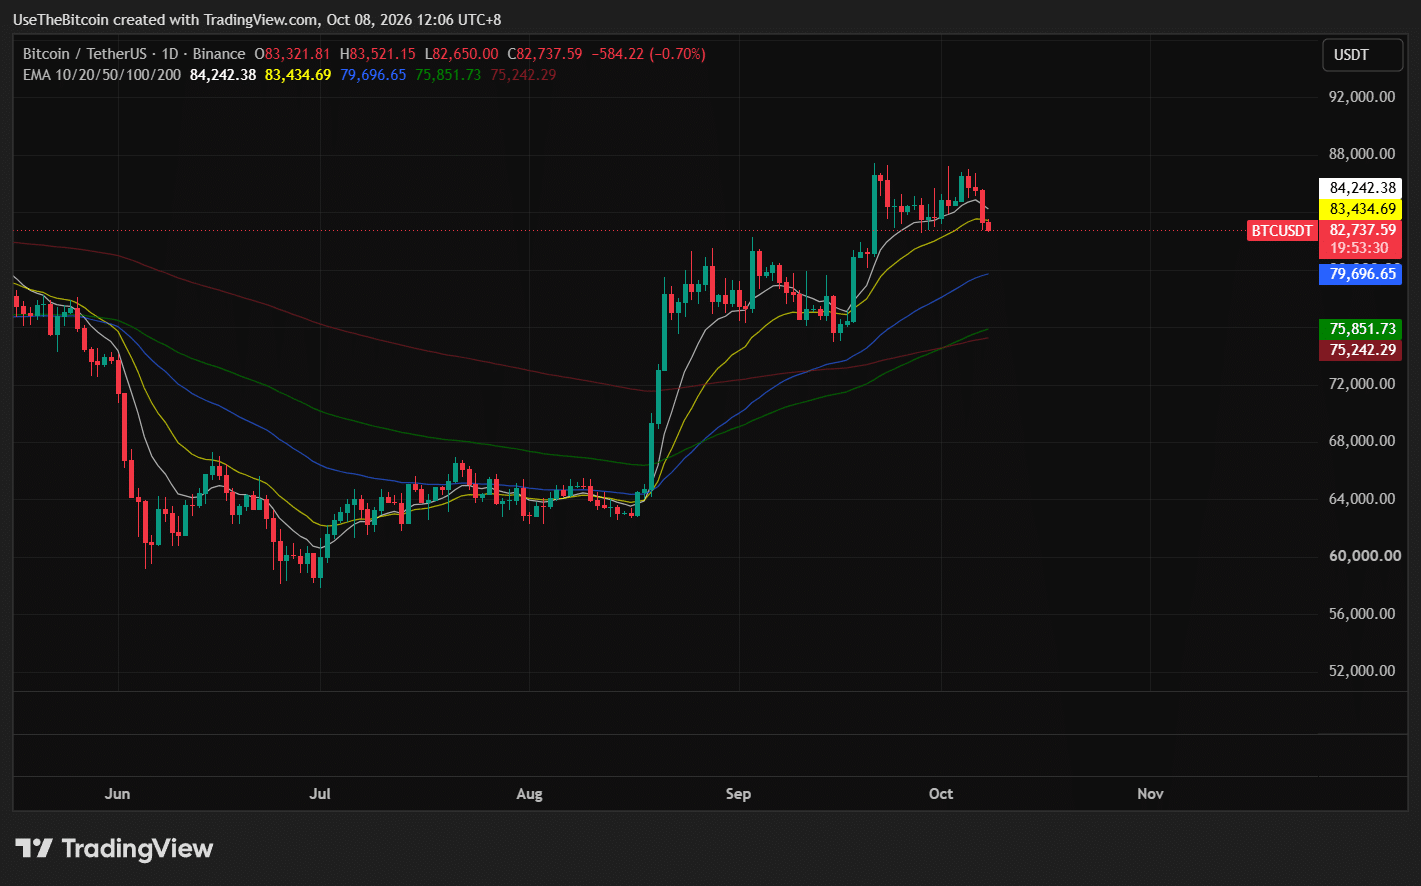
Bitcoin is still trading above its 100-day and 200-day moving averages, which were recently positioned near $72,000.
The broader recovery from June’s low therefore remains intact unless additional support levels begin breaking.
The first recovery target is $84,200. Reclaiming that level would indicate that Bitcoin has regained an important short-term price reference following the liquidation-driven decline.
The next resistance sits near $85,500, followed by $86,700 to $88,000.
A confirmed daily close above $88,000 would strengthen the case for another advance toward $90,000 to $92,000.
The bearish scenario begins with a sustained breakdown below the current $81,000 to $83,000 support region.
If $81,000 fails, Bitcoin could move toward $80,000, followed by approximately $78,100.
A deeper correction would bring the broader $75,000 to $78,000 demand zone into play.
The next scenario table summarizes the levels and conditions that would determine whether Bitcoin stabilizes or extends its decline.
| Scenario | What Would Support It | Levels to Watch |
| Bullish Case | BTC defends $81K-$83K, reclaims $84.2K, and closes above $86.7K-$88K | $90K-$92K |
| Base Case | BTC holds $81K but struggles to recover above $86.7K | $81K-$86.7K consolidation |
| Bearish Case | BTC loses $81K amid persistent selling and elevated leverage | $78K-$80K, then $75K-$78K |
Table 2. Bitcoin Bullish, Base and Bearish Scenarios
Final Thoughts
Bitcoin’s short-term outlook has weakened after falling below $83,000, with the $81,000 to $83,000 region now determining whether the latest correction stabilizes.
A recovery above $84,200 would improve immediate momentum, but stronger bullish confirmation requires BTC to reclaim $86,700 to $88,000. Losing $81,000 would increase the risk of another decline toward $78,000 to $80,000.
The main risk remains a combination of elevated derivatives exposure and higher interest rates. The Federal Reserve has signaled that another hike may be necessary, although its timing remains uncertain.
For additional context on monetary policy and digital assets, explore our Bitcoin guides.
This article is for informational purposes only and does not constitute financial advice. Crypto price predictions are based on market conditions and analyst estimates and are not guarantees of future performance. Do your own research before making any investment decisions.
Frequently Asked Questions
Need a refresher? Here are the questions most readers ask about Bitcoin’s current price setup and the latest Federal Reserve minutes.
Why Did Bitcoin Fall Below $83,000?
Bitcoin declined after repeated failures near $87,000 to $88,000. Rising Treasury yields, a stronger dollar, and leveraged liquidations contributed to selling pressure. The latest Fed minutes added uncertainty about future interest rates, although the decline began before their release.
What Did the October 7 Fed Minutes Say About Interest Rates?
The minutes showed that Federal Reserve officials broadly anticipated another rate hike could be appropriate before the end of 2026. However, they did not establish a specific date, and markets continued to favor holding rates steady at the October 27-28 meeting.
What Is Bitcoin’s Main Support Right Now?
Bitcoin’s immediate support lies between $81,000 and $83,000. A sustained break below $81,000 could expose the $78,000 to $80,000 region, followed by the broader demand zone near $75,000.
How Much Was Liquidated During Bitcoin’s Latest Drop?
The initial sell-off triggered approximately $550 million in crypto long liquidations over 24 hours. Later reporting placed broader liquidations near $696 million as the decline continued. These figures cover the wider crypto market, not Bitcoin alone.
Can Bitcoin Recover Toward $90,000 in October?
A recovery toward $90,000 remains possible if Bitcoin holds the $81,000 to $83,000 support region, reclaims $84,200, and establishes a confirmed breakout above $86,700 to $88,000. Continued ETF demand and easing Treasury yields could support that scenario, but elevated leverage and uncertainty over Federal Reserve policy remain risks.