
Bitcoin is trading around $83,500 on the first day of October after failing to hold its latest move above $85,000.
The pullback puts BTC back near the lower end of its recent consolidation, with $83,000 to $83,400 now acting as the first support zone. Below that, $82,000 and $80,000 are the main levels to watch. On the upside, Bitcoin still needs to reclaim $85,000 to $85,500 before the September high near $87,400 comes back into play.
The broader trend remains intact for now, but short-term momentum has weakened. Exchange-traded fund (ETF) inflows and recent derivatives deleveraging continue to support the market, while profit-taking and rising US Treasury yields are limiting Bitcoin’s upside.
$83K Is Now Bitcoin’s Immediate Support
With BTC back near $83,500, the $83,000 to $83,400 area becomes the most important short-term level.
Bitcoin traded near this zone on September 30, while recent technical data placed a daily pivot around $83,372.
Holding above this area would keep BTC inside its current consolidation and leave room for another attempt at the $85,000 resistance zone.
A break below $83,000 would put $82,000 back in play.
Below that, the stronger support remains near $80,000, which carries both psychological and technical importance.
| Bitcoin Level | Role |
| $85,000-$85,500 | Immediate resistance |
| $87,300-$87,400 | September high |
| $90,000-$92,000 | Higher resistance zone |
| $83,000-$83,400 | Immediate support |
| $82,000 | Short-term support |
| $80,000 | Major support |
| $77,000-$78,000 | Deeper support zone |
Table 1. Bitcoin Key Support and Resistance Levels
$85K to $85.5K Remains the First Upside Test
Bitcoin’s recent attempts above $85,000 have struggled to hold, as sellers remained concentrated around $85,000 to $85,500, making this the first level BTC needs to reclaim for the short-term structure to improve.
A sustained move through $85,500 would reopen the path toward the September high near $87,300 to $87,400. That level is more important than $85,000 because clearing it would establish a fresh short-term high.
Above $87,400, the next broader resistance zone sits around $90,000 to $92,000. Higher targets such as $100,000 remain dependent on Bitcoin first clearing these intermediate levels.
With BTC currently trading around $83,500, the market has not yet confirmed that kind of breakout.
Daily Trend Still Holds Despite Short-Term Weakness
Bitcoin’s broader technical structure remains stronger than its short-term momentum.
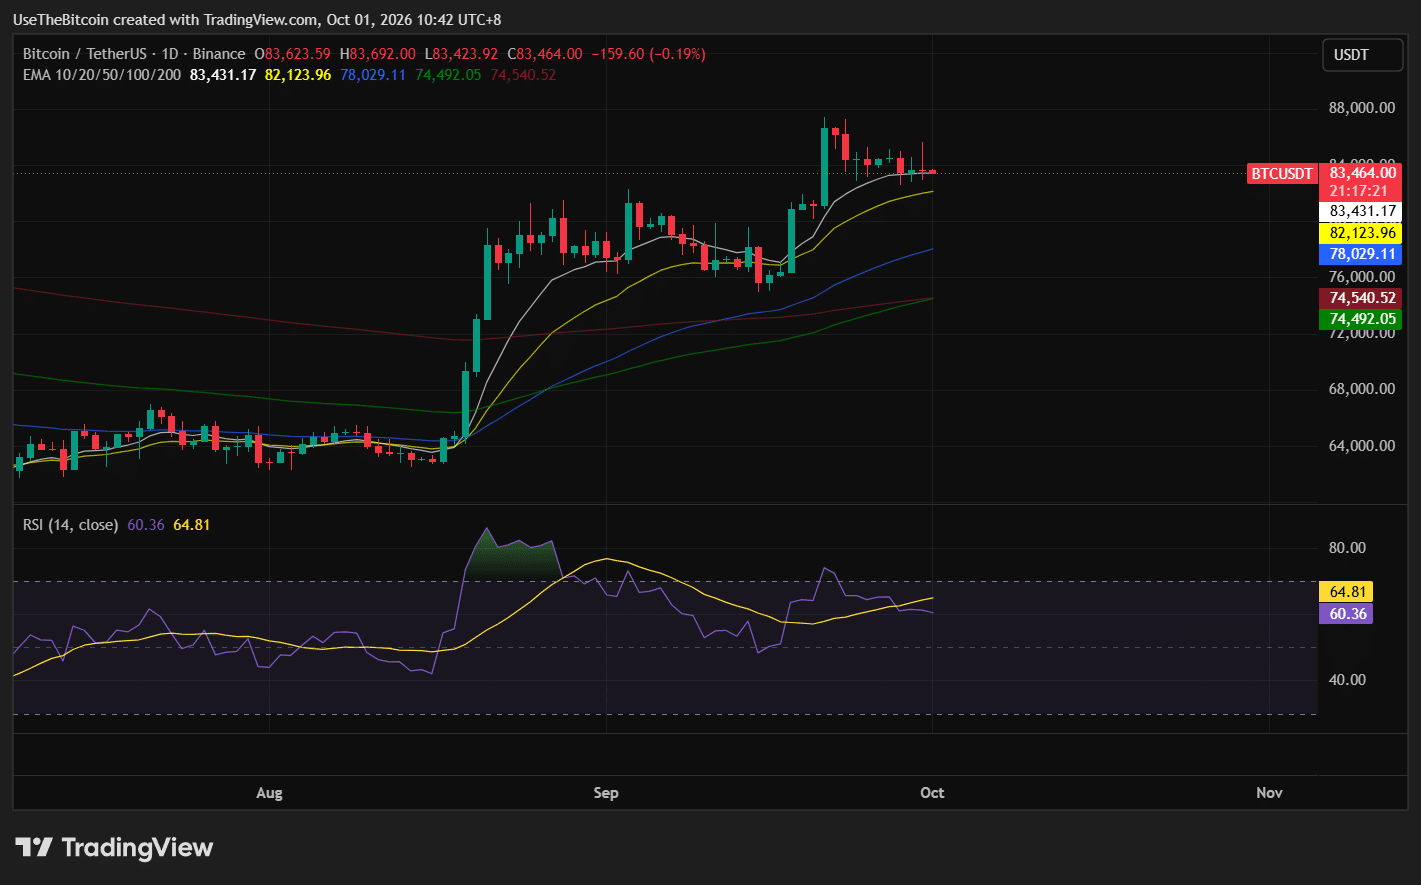
Going into October, BTC was still trading above its 20-day, 50-day and 200-day exponential moving averages (EMAs), keeping the larger recovery structure intact.
Shorter timeframes have been weaker, with recent four-hour Relative Strength Index (RSI) readings falling below the neutral 50 level, while the Moving Average Convergence Divergence (MACD) also showed reduced momentum during the pullback.
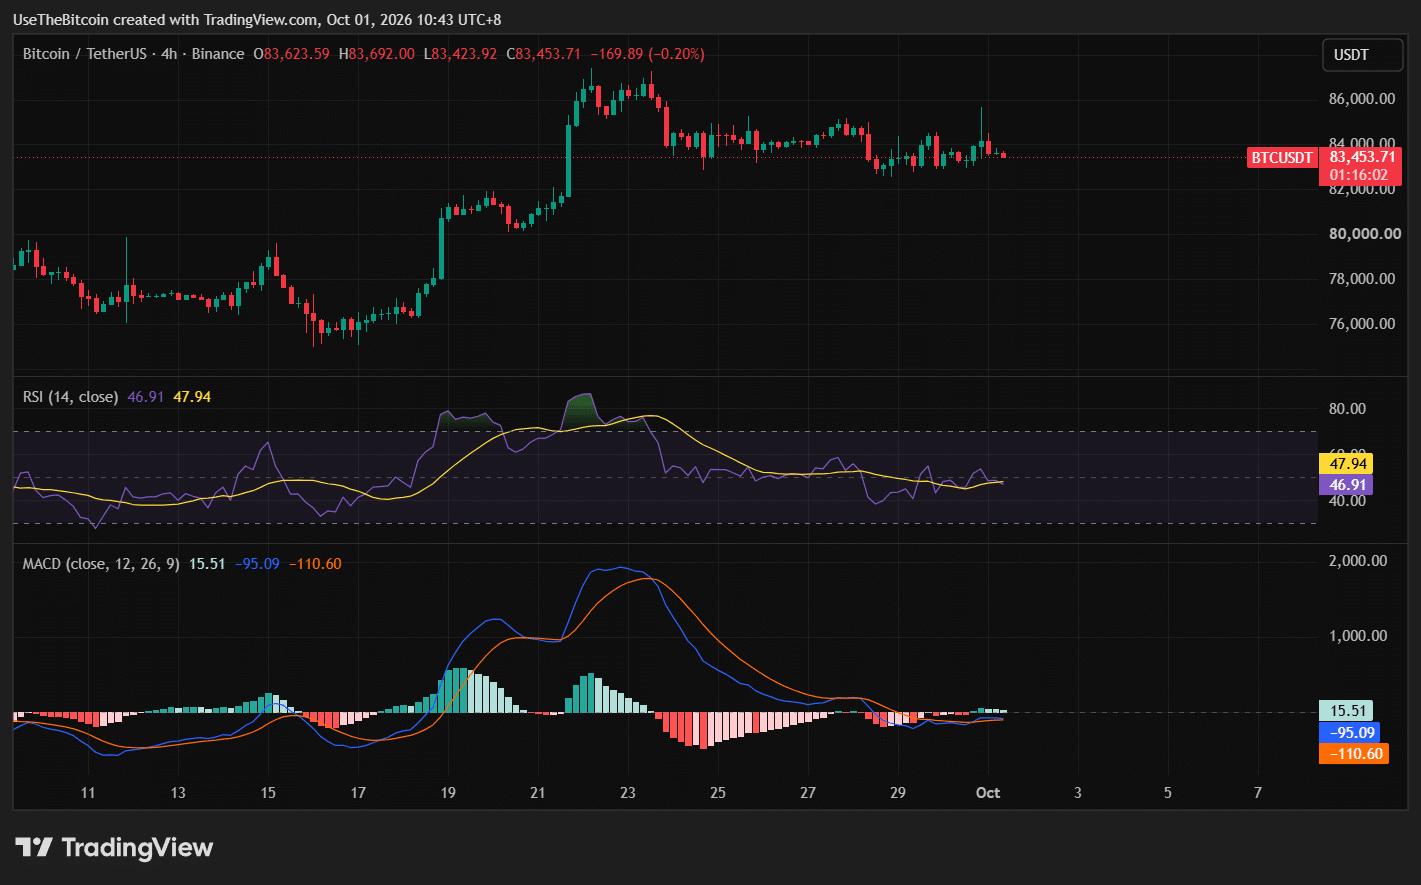
That combination fits the current price action: Bitcoin has not broken its larger recovery structure, but buyers have also failed to generate enough momentum to push BTC convincingly above $85,000.
The low-$83,000 area now determines whether that consolidation continues or turns into a deeper correction.
Profit-Taking Continues Near Recent Highs
One reason Bitcoin has struggled to extend its September rally is that more profitable holders have been selling into strength.
However, this selling has not caused a major breakdown, but it has increased the supply buyers must absorb before Bitcoin can move through the $85,000 to $87,400 range.
At $83,500, the question is whether buyers continue absorbing that supply around support or whether sellers push BTC toward $82,000 and $80,000.
ETF Inflows Remain a Source of Support
US spot Bitcoin ETFs have continued to attract net inflows.
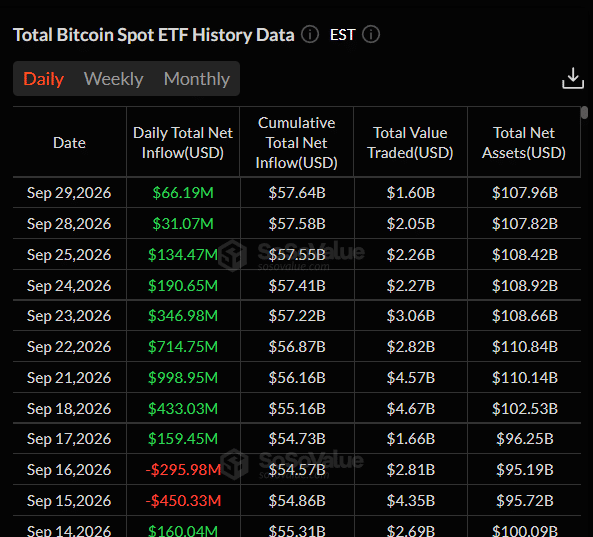
Recent data from SoSoValue showed the products extending a multi-day positive streak, with roughly $3.1 billion entering during a nine-session run.
However, the daily pace has cooled compared with the stronger inflows recorded earlier in September.
If ETF inflows accelerate again while BTC holds above $83,000, they could help absorb the supply currently limiting upside.
If flows weaken while price loses support, the market would have less institutional demand available to cushion another decline.
Rising Treasury Yields Top 5.3% and Remain a Macro Headwind
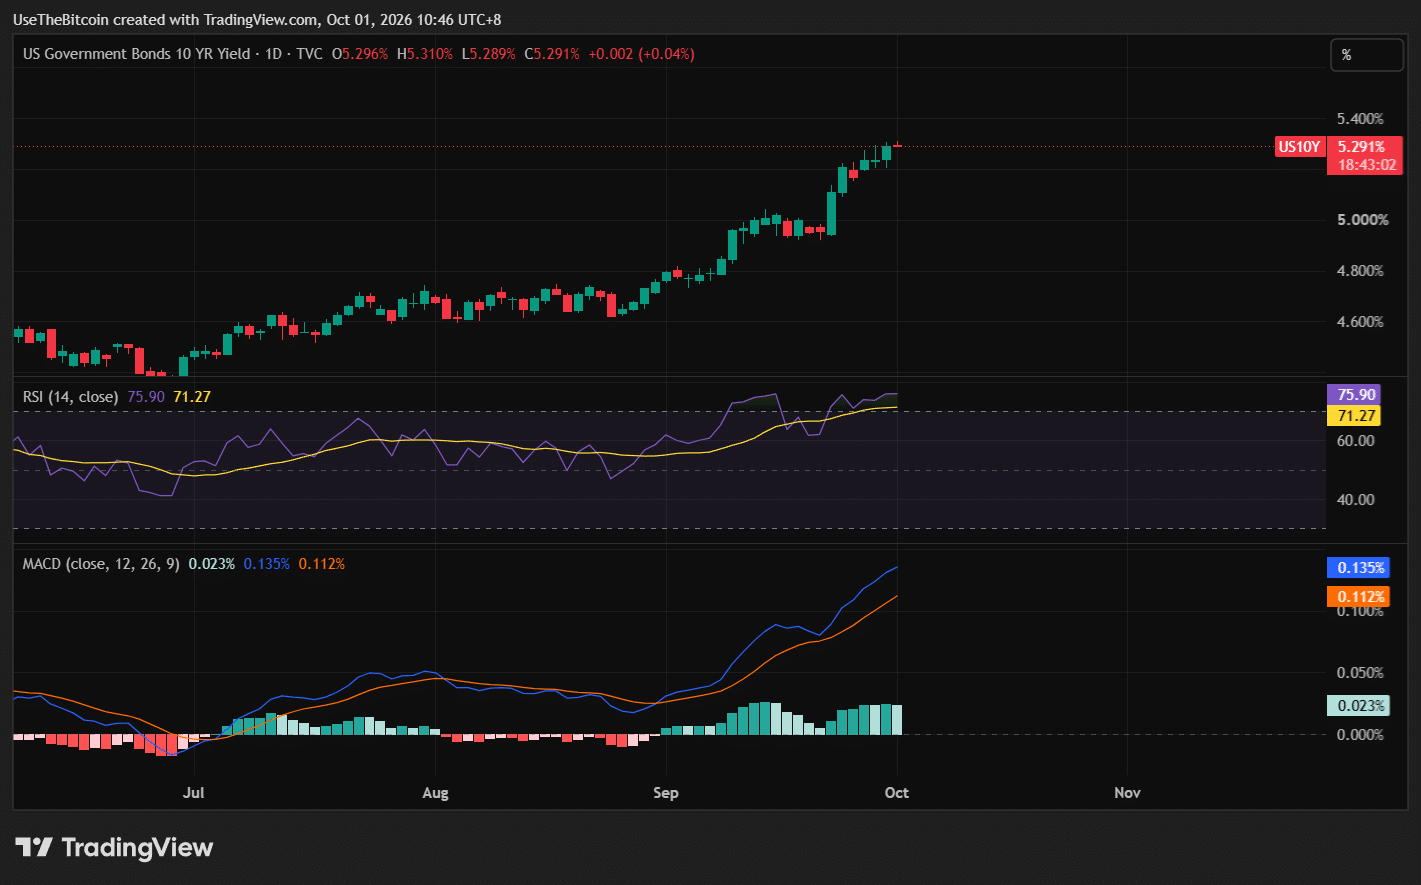
Bitcoin is also trading against a difficult interest-rate backdrop. The US 10-year Treasury yield finished September near 5.29%, keeping borrowing costs high and increasing the relative appeal of yield-bearing assets. For context, yields are at their highest level since May 2002.
Higher Treasury yields can pressure Bitcoin because BTC does not produce a native yield simply from holding it.
That does not create a direct one-to-one relationship between yields and Bitcoin price, but elevated rates can reduce demand for risk assets when investors can earn higher returns from government bonds.
For now, this remains one of the biggest macro factors working against a stronger BTC breakout.
$80K Remains the Main Invalidation Level
Bitcoin’s current structure remains relatively straightforward.
Holding $83,000 to $83,400 keeps the market inside its recent consolidation.
A rebound from that zone would put $85,000 to $85,500 back in focus.
A drop to $83,000 increases the probability of another test of $82,000.
A sustained break below $82,000 would shift attention toward $80,000, which remains the more important technical level.
A break below $80,000 would weaken the broader recovery structure and expose the $77,000 to $78,000 region next.
| Scenario | What Would Support It | Levels to Watch |
| Bullish Case | BTC holds $83K and reclaims the 85K–85.5K resistance zone | $87.4K, then $90K-$92K |
| Base Case | BTC holds above $82K but remains capped below $85.5K | $82K-$85.5K consolidation |
| Bearish Case | BTC loses $82K and fails to defend $80K | $77K-$78K, then deeper support |
Table 2. Bitcoin Bullish, Base and Bearish Scenarios
Bottom Line
Bitcoin at $83,500 is trading much closer to support than resistance.
The immediate level to defend is $83,000. Holding that area keeps the current consolidation intact and leaves room for another attempt at $85,000 to $85,500.
If BTC loses $83,000, the next levels are $82,000 and then $80,000. A sustained break below $80,000 would weaken the broader recovery structure and expose the $77,000 to $78,000 area.
On the upside, Bitcoin still needs to reclaim $85,500 before the September high near $87,400 becomes relevant again.
For now, the setup is less about an immediate breakout and more about whether buyers can keep defending the low-$83,000 range.
This article is for informational purposes only and does not constitute financial advice. Crypto price predictions are based on analyst estimates and are not guarantees of future performance. Do your own research before making any investment decisions.
Frequently Asked Questions
Need a refresher? Here are the questions most readers ask about Bitcoin’s current price setup.
What Is Bitcoin’s Main Support Right Now?
The immediate support sits around $83,000 to $83,400. Below that, $82,000 is the next short-term level, followed by the stronger $80,000 support zone.
What Is Bitcoin’s Main Resistance?
Bitcoin’s first resistance is between $85,000 and $85,500. Above that, the September high near $87,300 to $87,400 becomes the next major level.
What Happens if Bitcoin Falls Below $83,000?
A sustained move below $83,000 would increase the risk of a drop toward $82,000. If $82,000 also fails, $80,000 becomes the next major support.
Are Bitcoin ETF Flows Still Positive?
Recent US spot Bitcoin ETF data has remained positive, including a multi-session inflow streak. However, daily inflows have slowed from the stronger levels seen earlier in September.
Could Bitcoin Still Reach $90,000?
Bitcoin would first need to hold the current support area, reclaim $85,000 to $85,500 and then break above the September high near $87,400. Only after those levels are cleared would the $90,000 to $92,000 zone become the next meaningful upside area.