
Ethereum is trading around $2,680 on October 1 after spending the final days of September inside a narrow consolidation range.
ETH remains trapped between support around $2,620 to $2,660 and resistance near $2,775 to $2,825. A clean break above that resistance would reopen the path to $3,000, while a drop to the lower end of the range would expose $2,500 and the 200-day exponential moving average (EMA) near $2,272.
Softer US Personal Consumption Expenditures (PCE) inflation has helped ease some pressure on risk assets, but Ethereum has not yet turned that macro relief into a technical breakout.
Ethereum Remains Stuck Between $2.62K and $2.78K
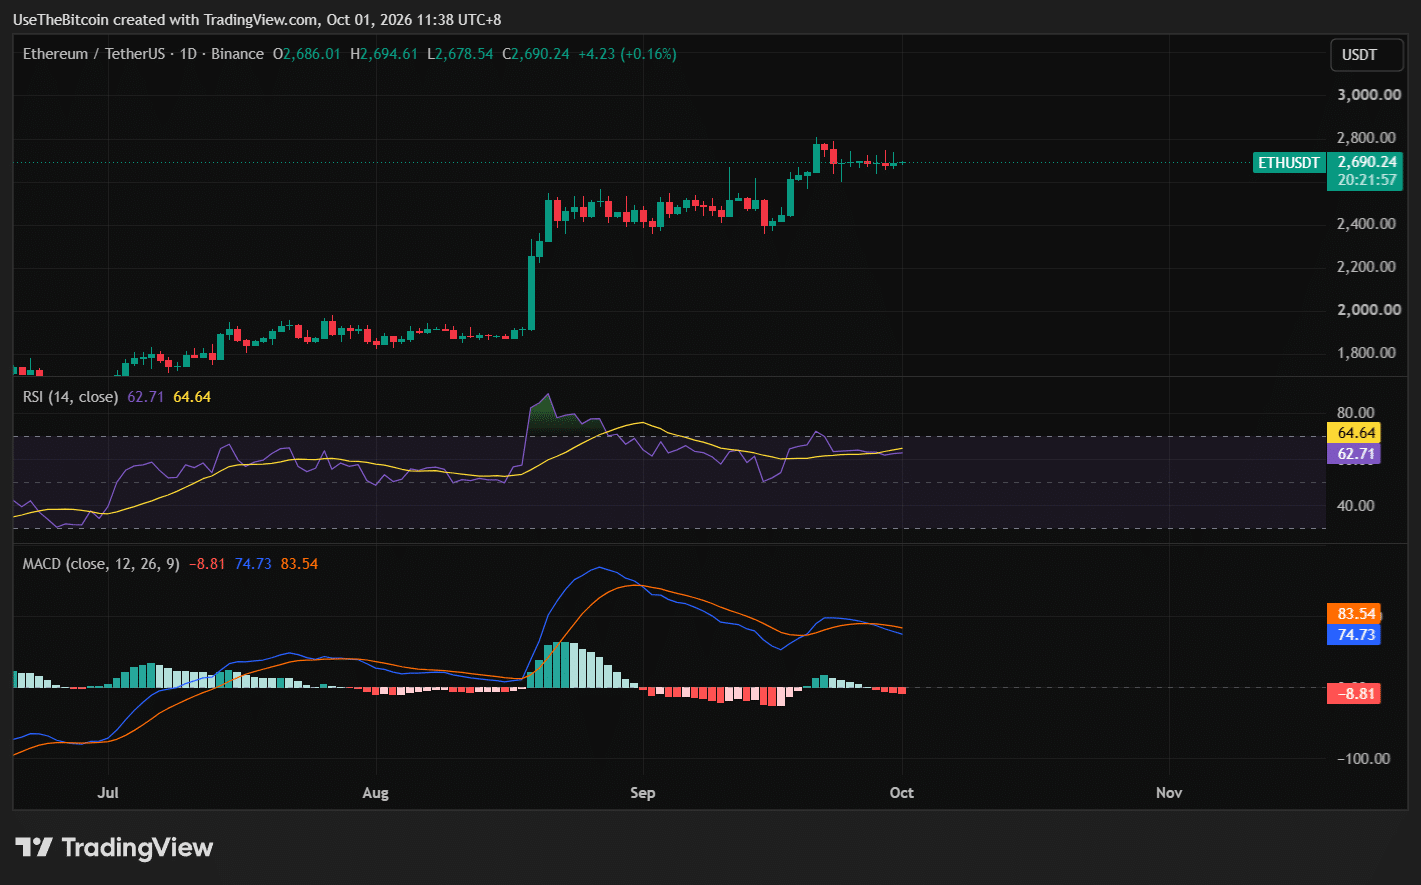
Ethereum has spent several sessions moving sideways rather than extending its September rally.
The immediate support zone sits around $2,620 to $2,660, while the first major resistance is concentrated between $2,775 and $2,825. ETH briefly traded above $2,800 earlier in the month but failed to hold, leaving that area as the main hurdle for buyers.
A sustained break above $2,825 would make $3,000 to $3,050 the next major upside zone.
If ETH instead falls below $2,620, the next support sits around $2,500, followed by the 200-day EMA near $2,272.
| Ethereum Level | Role |
| $2,775-$2,825 | Immediate resistance |
| $3,000 | Psychological resistance |
| $3,050 | Higher technical target |
| $2,620-$2,660 | Immediate support |
| $2,500 | Major support |
| $2,272 | Deeper technical support |
Table 1. Ethereum Key Support and Resistance Levels
PCE Inflation Cools as Rate-Hike Odds Drop
Ethereum received some macro support after the latest US inflation data came in below expectations.
August PCE inflation rose 3.4% year over year, below expectations of 3.7%, while core inflation also came in softer than forecast.
The weaker inflation print reduced the estimated probability of a 25-basis-point Federal Reserve rate increase at the October 28 Federal Open Market Committee (FOMC) meeting to around 34%, according to CME FedWatch data.
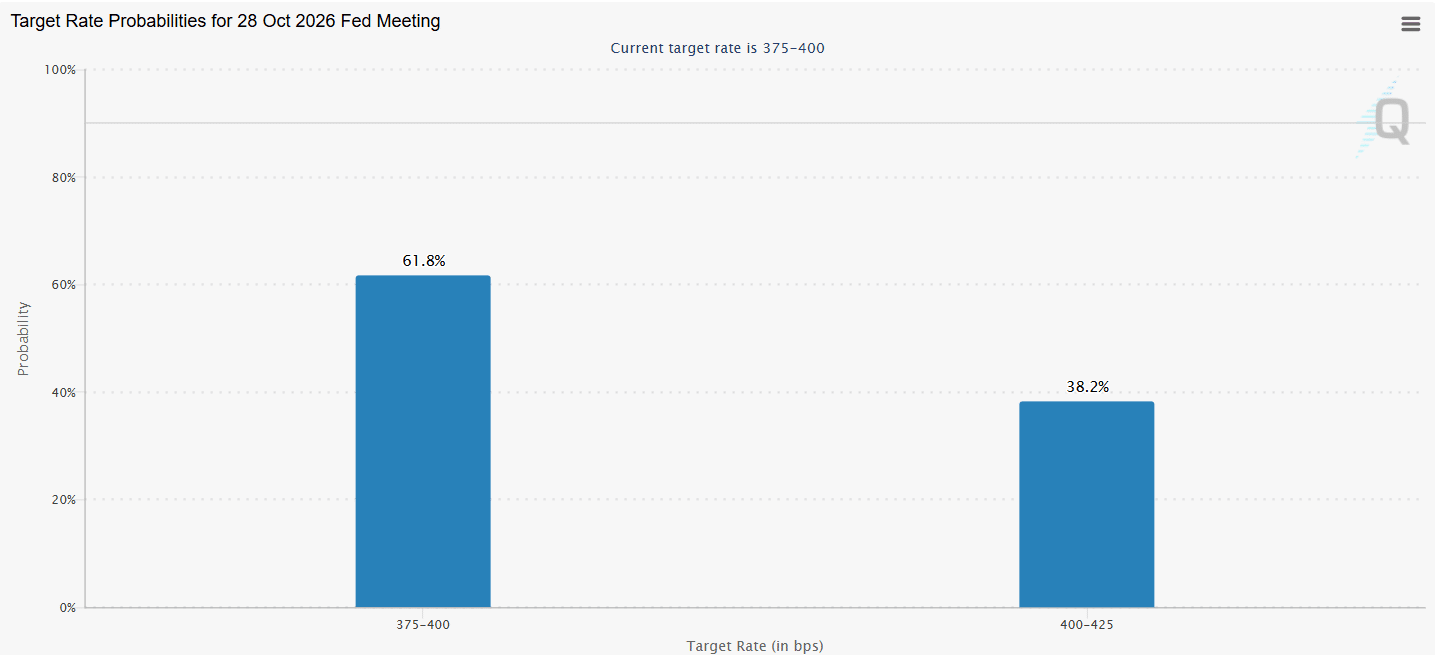
ETH briefly moved above $2,700 following the data before slipping back toward $2,680.
The muted reaction shows that softer inflation has improved the macro backdrop but still has not been enough to push Ethereum through its technical resistance.
Ethereum Open Interest Drops to Its Lowest Level Since March
The biggest shift in Ethereum’s market structure is happening in derivatives.

Open interest (OI) fell to 12.49 million ETH on September 30, the lowest level since March 1. Since ETH began recovering in early July, open interest has declined by roughly 1.46 million ETH even as spot price strengthened, showing traders are using less leverage than earlier in the rally.
Lower open interest can point to weaker speculative demand, but it can also reduce the risk of a liquidation-driven selloff because fewer leveraged positions remain open.
For Ethereum, that leaves the market in an unusual position: price is holding relatively firm while leverage continues to decline.
If ETH eventually breaks above $2,800 with open interest still controlled, the move would rely more on spot demand than on an aggressive buildup of futures positions.
ETF Demand Cooled at the End of September
Institutional demand also softened at month’s end. US spot Ethereum exchange-traded funds (ETFs) recorded approximately $2.81 million in net outflows on September 29, ending a seven-day inflow streak.
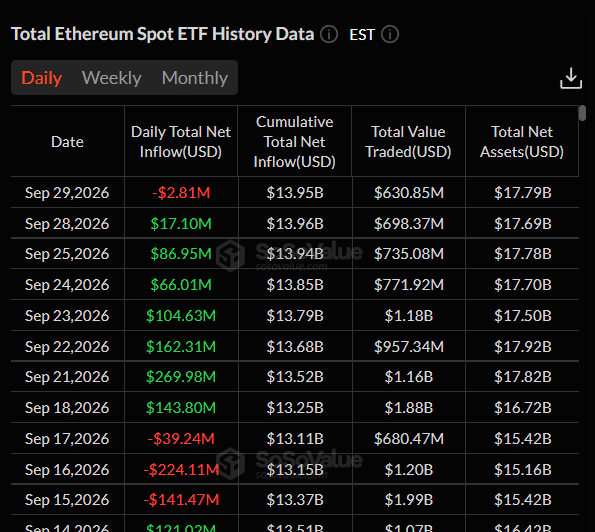
Despite that daily reversal, September still produced roughly $892 million in net inflows, marking a third consecutive positive month for Ethereum ETFs.
A renewed pickup in ETF inflows would give buyers another source of demand needed to absorb selling around $2,800.
$2.5K Is the Main Downside Level to Defend
Ethereum’s current range remains constructive while ETH holds above the mid-$2,600s, but the more important support is lower.
The $2,500 area is the first major downside level if $2,620 fails.
Below that, Ethereum’s 200-day EMA sits near $2,272, while separate October technical analysis places a key bullish invalidation area around $2,445.
That creates a broader support zone around $2,445 to $2,500.
A sustained break below that area would weaken the September breakout structure and increase the risk that ETH gives back more of its recent advance.
Ethereum’s Broader Trend Still Favors Consolidation Over Breakdown
Ethereum is still trading above its 200-day EMA, keeping the broader trend stronger than the short-term price action suggests.
ETH has also spent several weeks holding above the former breakout area around $2,500 to $2,550, which previously acted as resistance.
As long as that zone holds, the current move looks more like consolidation after a strong September advance than a confirmed reversal.
A move below $2,445 to $2,500 would change that interpretation.
| Scenario | What Would Support It | Levels to Watch |
| Bullish Case | ETH holds above $2.62K and closes above $2.825K | $3,000, then $3,050 |
| Base Case | ETH remains above $2.5K but cannot clear $2.8K | $2.5K-$2.825K consolidation |
| Bearish Case | ETH loses $2.5K and breaks below $2.445K-$2.462K | Lower support below $2.4K |
Table 2. Ethereum Bullish, Base and Bearish Scenarios
Bottom Line
Ethereum is holding around $2,680, but it remains stuck below the same resistance that has capped several recent attempts higher.
The first level buyers need to reclaim is $2,775 to $2,825. A sustained move through that zone would make $3,000 the next major target, followed by roughly $3,050.
On the downside, $2,620 to $2,660 is the first support area. The more important level remains $2,500, with the 200-day EMA and broader invalidation zone.
Softer PCE inflation has reduced some macro pressure, while falling open interest has lowered leverage risk. ETF flows remain positive monthly, although the latest daily outflow shows institutional buying has slowed.
For now, Ethereum remains in consolidation. The next directional move becomes more convincing only after ETH either breaks above $2,825 or loses the $2,500 region.
This article is for informational purposes only and does not constitute financial advice. Crypto price predictions are based on analyst estimates and are not guarantees of future performance. Do your own research before making any investment decisions.
Frequently Asked Questions
Need a refresher? Here are the questions most readers ask about Ethereum’s current price setup.
What Is Ethereum’s Main Resistance Right Now?
The main resistance sits between $2,775 and $2,825. A sustained move above that zone would bring $3,000 and then approximately $3,050 into focus.
What Is Ethereum’s Main Support?
Immediate support sits around $2,620 to $2,660. Below that, $2,500 is the major support level, followed by the 200-day EMA near $2,272.
Why Is Ethereum Open Interest Falling?
Ethereum open interest has dropped to 12.49 million ETH, its lowest level since March, as traders reduce leveraged futures exposure. That can signal weaker speculative demand while also lowering the risk of forced liquidations.
Are Ethereum ETF Flows Still Positive?
For September overall, yes. Spot ETH ETFs attracted roughly $892 million during the month, although September 29 recorded about $2.81 million in net outflows and ended a seven-day inflow streak.
Can Ethereum Reach $3,000 in October?
Ethereum would first need to clear the $2,775 to $2,825 resistance zone and establish support above it. If that happens, $3,000 becomes the next major psychological level, but the move is not confirmed while ETH remains below $2,800.