Key Takeaways
- The Solana 15 minute chart balances speed and clarity better than shorter timeframes.
- Volume confirms whether a breakout is real or a fakeout worth avoiding.
- Clean entries and proper stop placement separate profitable setups from costly mistakes.
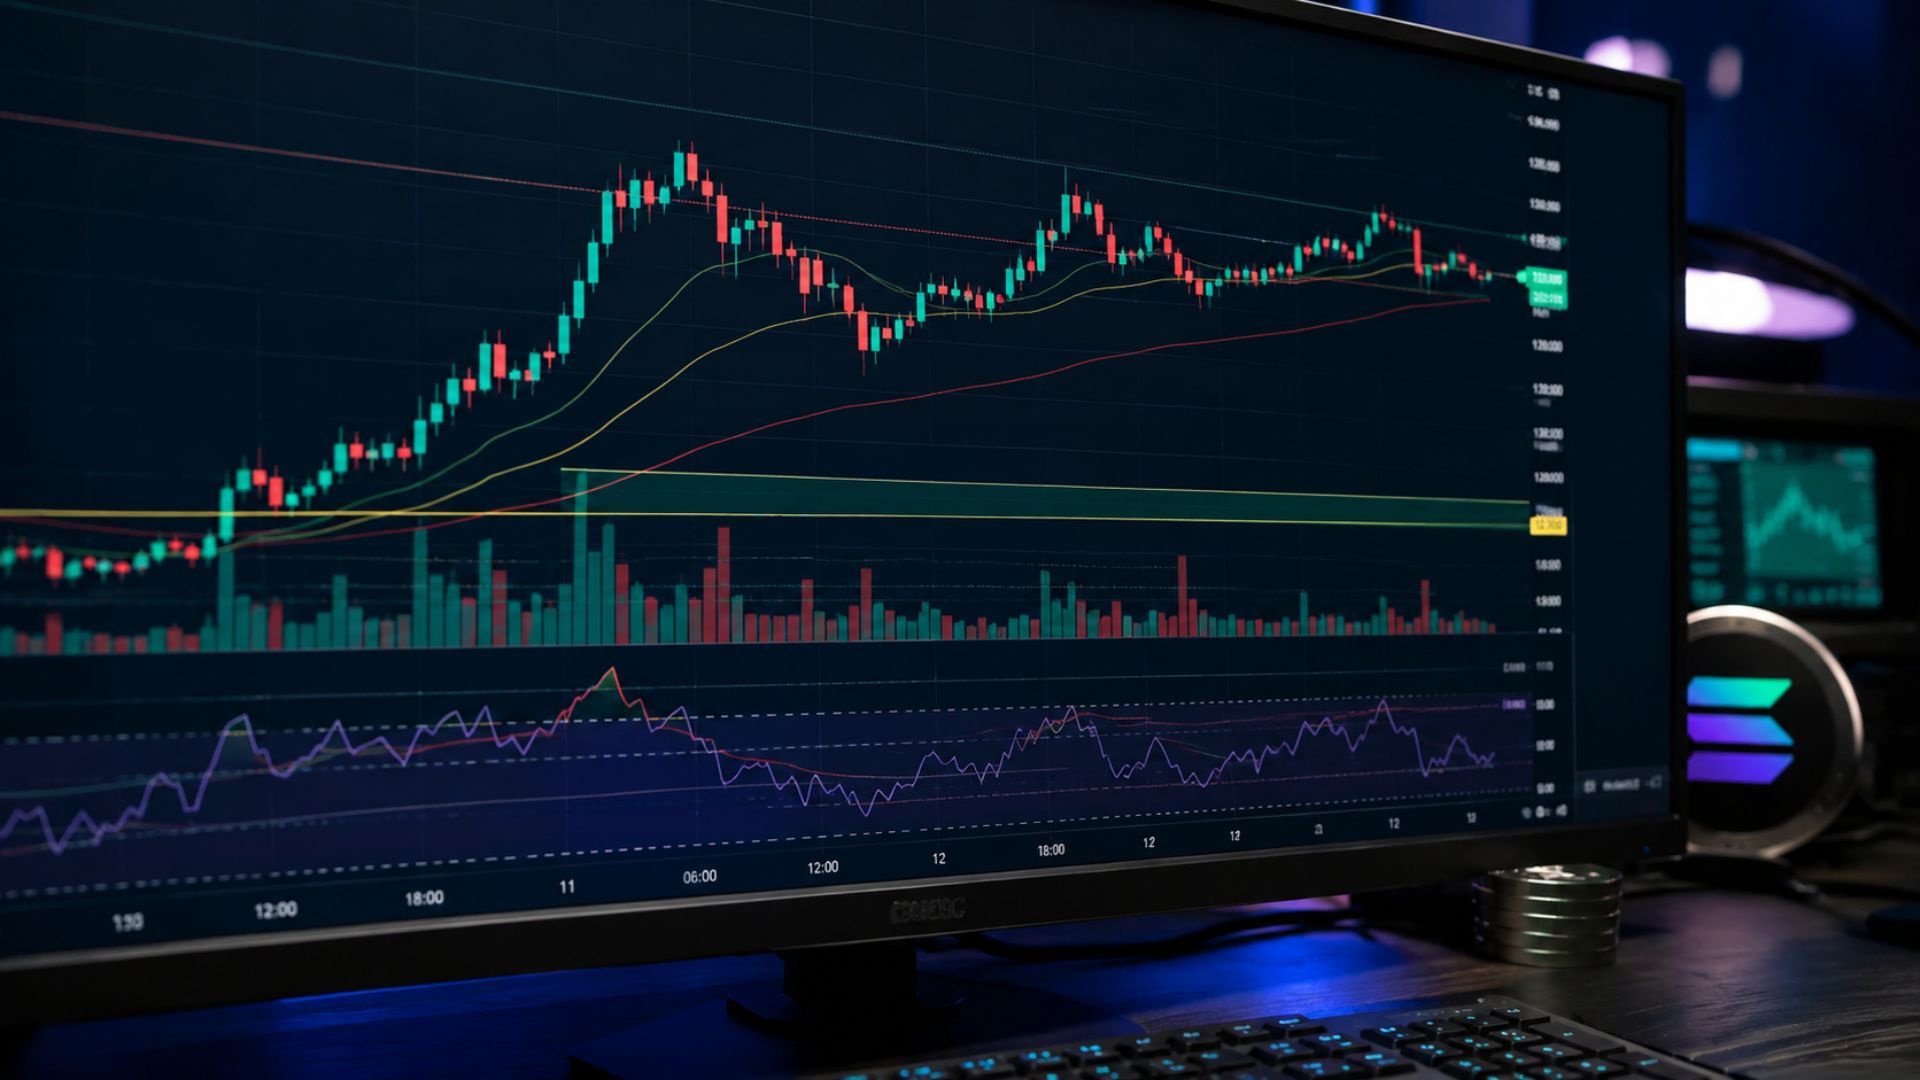
Solana moves fast. Anyone watching SOL during an active session knows how quickly a setup can form and disappear before you even have time to react. The 15-minute chart sits in a sweet spot for short-term traders because it filters out the noise of the 1-minute and 5-minute charts while still keeping you close enough to catch solid intraday moves worth acting on.
This guide breaks down how to read that timeframe properly, from the patterns worth watching to the volume cues that tell you whether a move has real legs behind it.
Why Does the 15-Minute Chart Work for Solana?
Solana has high throughput and a deep spot market, and that combination means price moves on shorter timeframes carry real, readable information. The 1-minute chart on SOL can feel chaotic, with candles whipping back and forth without giving you much to work with. The 15-minute frame smooths that out without making you wait too long for a setup to develop into something tradeable.
Most traders who use this timeframe pair it with a higher-level view like the 1-hour or 4-hour chart to confirm trend direction first. Once you know whether the bigger picture is bullish or bearish, you use the Solana 15 minute chart to time your entry with more precision and less guesswork.
What Patterns Show Up on the 15-Minute SOL Chart?
Not every classic candlestick pattern translates well to a 15-minute chart, and some produce too many false signals to be useful on a fast-moving asset like Solana. The patterns below tend to hold up consistently on this timeframe and give traders something concrete to act on.
- Bull flag after a sharp move up. SOL often consolidates in a tight range after a fast push higher. A clean bull flag with declining volume during the pullback is a reliable continuation signal, especially when the prior move was strong.
- Bearish engulfing at resistance. When price hits a known resistance level and a large red candle fully swallows the previous green one, that shift in momentum is a clear warning sign worth taking seriously.
- Inside bar setups. An inside bar signals that the market is pausing and collecting itself. A break in either direction with a volume spike often kicks off the next leg of the move.
- Double bottom with rising volume. Two tests of the same low followed by a volume spike on the second test frequently come before a meaningful reversal, particularly near key support zones.
These patterns carry the most weight when they form near obvious horizontal levels, prior session highs and lows, or areas where price has repeatedly stalled before.
How Does Volume Confirm or Cancel a Setup?
Volume is the most important secondary signal on the Solana 15 minute chart, and skipping this step is one of the most common reasons traders take losses on setups that looked clean on price action alone.
Here are the core rules to follow when reading volume on this timeframe:
- Breakouts without volume are suspect. If SOL breaks above a resistance level but volume stays flat or drops during the move, the smart play is to wait. These moves reverse quickly and trap buyers who acted too early.
- Volume spikes on consolidation breakouts carry real weight. When a tight range finally breaks with a clear surge in volume, that setup tends to follow through and give traders a clean run toward the next target.
- Diverging volume signals a weakening trend. If SOL keeps printing higher highs but volume shrinks on each push, the trend is running out of fuel. That is the time to tighten stops or reduce exposure before the reversal hits.
Pairing this with live Solana price USD data gives you additional context and helps you separate genuine momentum from noise.
How Do You Set Entries, Stops, and Targets on the 15-Minute Frame?
On the Solana 15-minute chart, the guide sets entries after a candle closes, stops below the most recent swing low on long trades (typically 0.5% to 1.5% from entry, away from round numbers) and a first target at the prior swing high, where part of the position is scaled out. Strong-volume setups may add a second target.
When Should You Enter a Trade?
Wait for the candle to close before entering a position. A 15-minute candle that looks like a textbook breakout at minute 10 can reverse completely by minute 15, and entering mid-candle is one of the fastest ways to get caught on the wrong side of a move.
Where Should Your Stop Go?
For long trades, place your stop below the most recent swing low. On the Solana 15 minute chart, that distance typically falls between 0.5% and 1.5% from your entry, depending on how volatile the session is at that moment. Avoid placing stops at round numbers, as those levels often get swept before price continues in your direction.
How Do You Set a Realistic Target?
Use the prior swing high as your first target and scale out a portion of your position there. If the setup has strong volume behind it, hold a partial position for a second target and trail your stop to lock in gains as price moves in your favor.
For a broader view of where SOL might be heading over time, the Solana price prediction page covers what analysts are watching. If you are also exploring ways to earn while you hold, the Solana staking guide breaks down current options worth considering in 2026.
Frequently Asked Questions
What is the best time of day to use the Solana 15 minute chart?
The most active windows for SOL are during the US market open from around 9:30 AM to 11:30 AM EST and during the Asian session overlap in the early morning hours. Volume runs highest during these windows, which makes setups on the Solana 15 minute chart more reliable and easier to read with confidence.
How do you avoid fakeouts on the 15-minute SOL chart?
Wait for candle closes before entering, check that volume confirms the move, and always look at the 1-hour chart for context. Most fakeouts happen when traders react to candles mid-formation rather than waiting for the close to confirm the direction of the move.
What indicators pair well with the Solana 15 minute chart?
Volume profile, VWAP, and the 20-period EMA are among the most widely used tools by short-term SOL traders. They help you identify where price sits relative to average session activity and where support or resistance tends to develop naturally over time.
Can you use the Solana 15 minute chart for swing trading entries?
Yes, and many swing traders rely on it specifically for timing entries into setups they identified on higher timeframes. The pattern forms on the 4-hour or daily chart first, and then the 15-minute chart helps you get in with a tighter, more precise stop that keeps your risk manageable.