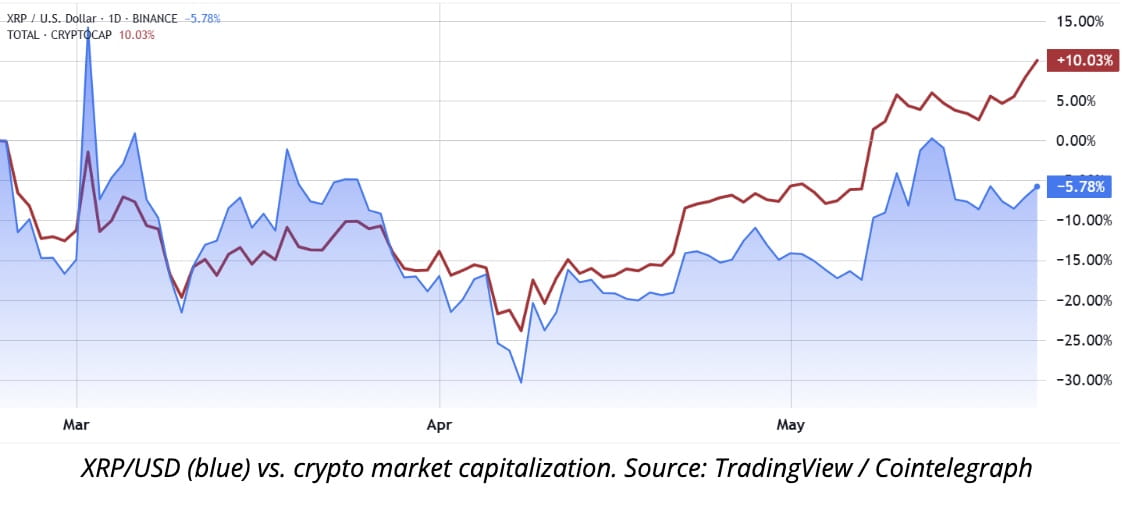
XRP’s recent price movements have taken a different path from those of other leading cryptocurrencies like Bitcoin and Ethereum. While those digital assets held relatively steady, XRP faced a sharp decline but is now showing signs of a potential rebound. Here’s a closer look at XRP’s latest trends, critical support and resistance levels, and the technical factors influencing its short-term trajectory.
XRP Attempts to Break Below $2.45 and Holds at $2.34

Unlike Bitcoin and Ethereum, which held their ground better, XRP made a strong attempt to fall below the $2.450 mark. During this effort, the price broke through important support levels at $2.40 and $2.35, eventually dropping close to $2.2850. The lowest point reached was $2.2848, suggesting that buyers stepped in around this level to stop the price from falling further. At the time of writing, the price is $2.34, according to TradingView.
Bounce Back and Key Fibonacci Points
After the drop, XRP started to climb again, moving above $2.32 and $2.35. This upward move carried the price beyond the halfway point of the recent decline, measured from the $2.449 peak down to the $2.848 bottom. This level, known as the 50% Fibonacci retracement, is important because traders often look at it to decide if the price will keep rising or turn back down.
Current Resistance and Trend Lines
Even though XRP has started to bounce back, it still faces strong resistance around the $2.40 level. The price currently trades above $2.35 and the 100-hour Simple Moving Average (SMA), which provides some short-term positive momentum. However, a bearish trend line connecting recent lower highs near $2.40 acts as a barrier, making it difficult for XRP to move higher right now.
At the time of writing, XRP has pulled back and is trading around $2.34. If the price can break above this trend line and hold, it could signal a stronger upward move. Until then, this trend line will likely keep limiting further gains and hold the price down.
Important Resistance Levels Ahead
Turning our attention to the price action further above, a key resistance area is located around the $2.42 mark. This particular level aligns with the 76.4% Fibonacci retracement of the recent downward move that started at $2.449 and went down to $2.848. If XRP can manage to climb above this critical point, it would be a positive indication for buyers, showing that the upward momentum is gaining strength. Clearing this barrier could open the door for a longer-lasting rise in price, giving bulls a better chance to maintain control and push the price even higher over time.
Can XRP Break Resistance or Drop Further?
If XRP cannot break above the $2.42 resistance and begins to drop, this could trigger a fresh downward move. The price may fall back toward key support areas like $2.35 or even lower. Falling below these support levels might indicate buyers losing confidence, which could increase selling pressure.
This situation may signal caution for buyers and traders, especially with XRP-related news such as developments with the SEC and other updates. Many will closely monitor whether XRP can maintain its current price or if further declines are likely, which could affect trading decisions and overall market sentiment throughout May.
Final Thoughts
XRP is showing signs of recovery after its recent dip, but it’s still facing strong resistance around the $2.40 to $2.42 range. This area has been difficult to break through, and until XRP moves above it with strong momentum, the risk of another drop remains. If buyers can push the price past $2.42 and hold it there, it could lead to a stronger upward move. However, if XRP fails to break out, it may fall back to lower support levels, possibly weakening market confidence. For now, traders should stay cautious and watch for clearer signals before making their next move.