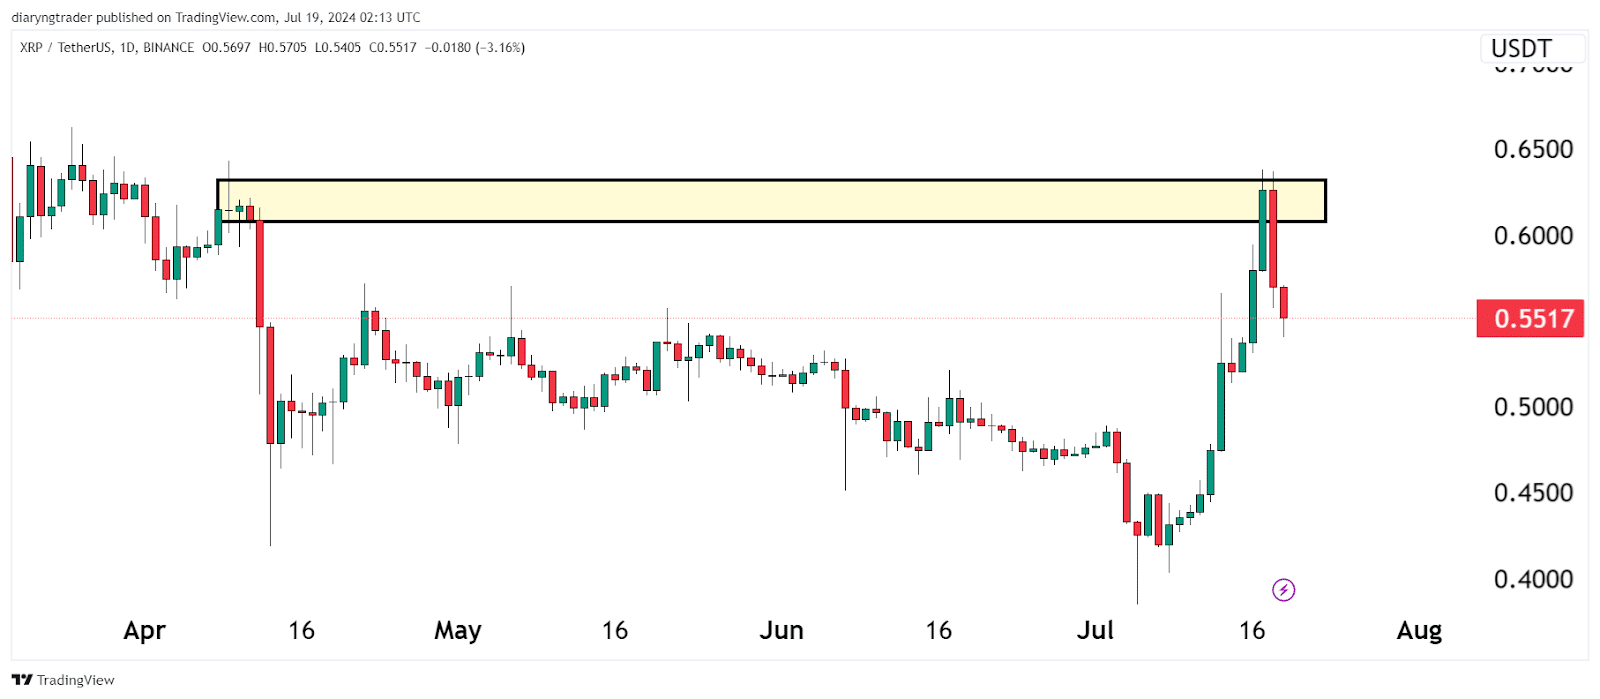
Let’s examine the insights shared by our Technical Analyst at UseTheBitcoin as he walks us through his personal trading approach and observations on the crypto market.
Shorting XRP At Resistance Levels
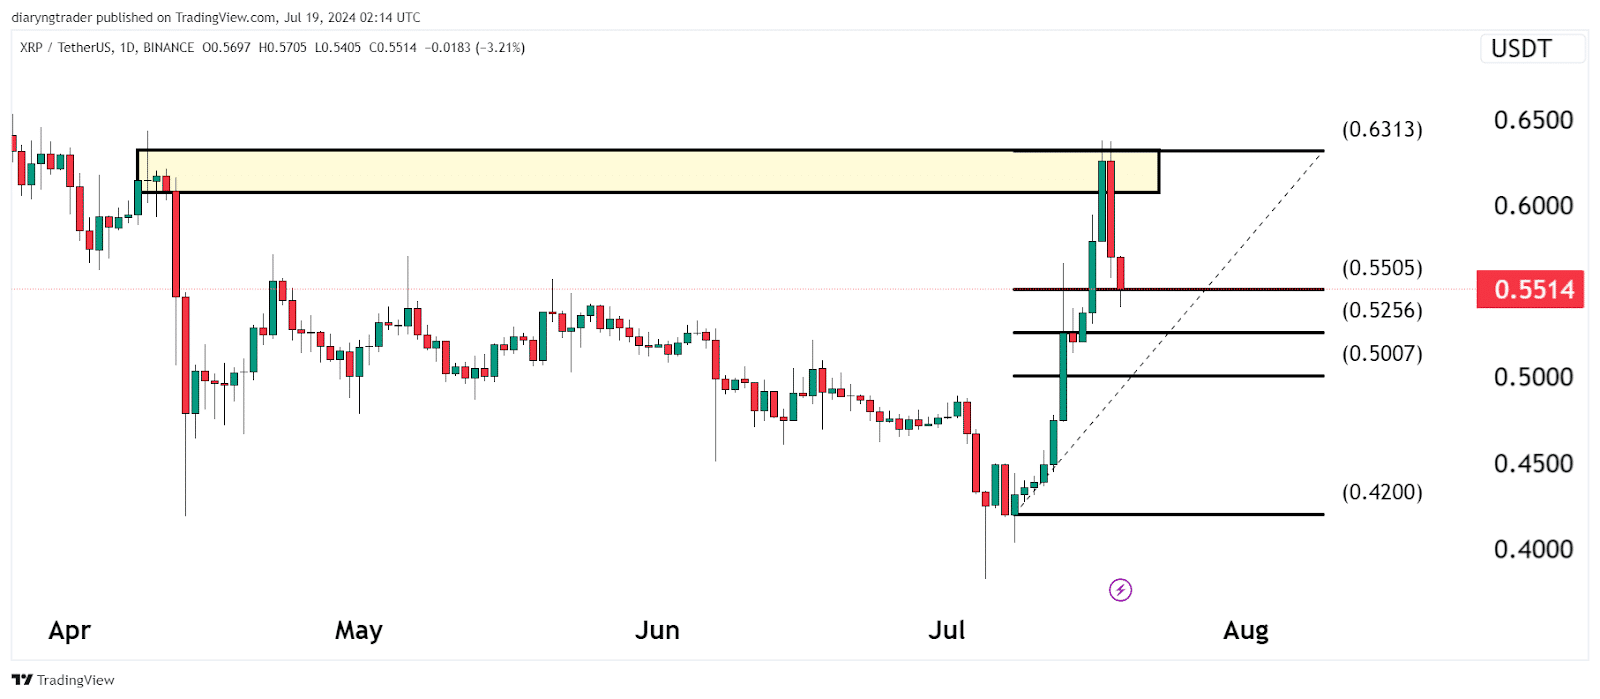
Recently, I initiated a short position on XRP as it approached the resistance levels of $0.60 to $0.63. This decision was based on the observation that investors who bought XRP at lower prices might seize the opportunity to sell as prices increased.
For those new to the term, shorting refers to selling an asset at a higher price to repurchase it at a lower price. Essentially, it is the inverse of traditional trading, where you buy low and sell high. In short (no pun intended), you profit from the decline in the asset’s price.
The Role Of Resistance Levels

Resistance levels are critical in technical analysis as they represent points where the price of an asset faces pressure on its way up. These levels are often psychological barriers where sellers outweigh buyers, leading to a price drop. In this case, the $0.60 to $0.63 range for XRP was identified as a resistance level, suggesting a potential reversal or consolidation.
Using Fibonacci Retracement For Profit Targets

To anticipate potential profit-taking levels, I used the Fibonacci retracement tool. This helps identify key levels where the price might find support during a retracement. The Fibonacci levels at $0.52 to $0.54 were particularly worth considering, as they align with the 50% and 61.8% retracement levels, often called the “golden ratio.”
Fibonacci retracement levels are derived from the Fibonacci sequence and are widely used in technical analysis to predict potential reversal points. The most commonly used levels are 38.2%, 50%, and 61.8%. These levels help traders identify where an asset’s price might find support or resistance, making them crucial for setting profit targets and entry points.
Re-entering The Market
For those looking to reenter the market after a short position, monitoring the price action at the Fibonacci golden levels ($0.49, $0.52, $0.54) is worth taking into account. These levels often act as strong support, providing a strategic entry point for new positions. If the price shows signs of bouncing at these levels, it could be an opportune moment to re-enter.
Final Thoughts
For more in-depth technical analysis like this one, make sure to subscribe and hit the notification bell on UseTheBitcoin’s YouTube channel. We post daily videos covering the crypto markets, so don’t miss out!


