XRP gained as high as 70% in the mid-third week of August from near $1 to almost $1.70 in a span of four days beginning August 19, its best month since 2021 and only the third time in nine years the month has finished positive. However, a historical seasonal pattern and shifting wallet data are raising real questions about whether that strength carries into September.
Where XRP’s August Gains Came From
Almost all of August’s rally arrived in the final two weeks. US spot XRP ETFs took in $153.55 million during the full month, but just $3.27 million of that came between August 3 and 14, with the remaining $150.28 million, roughly 46 times as much, arriving in the back half of the month alone, according to SoSoValue data.
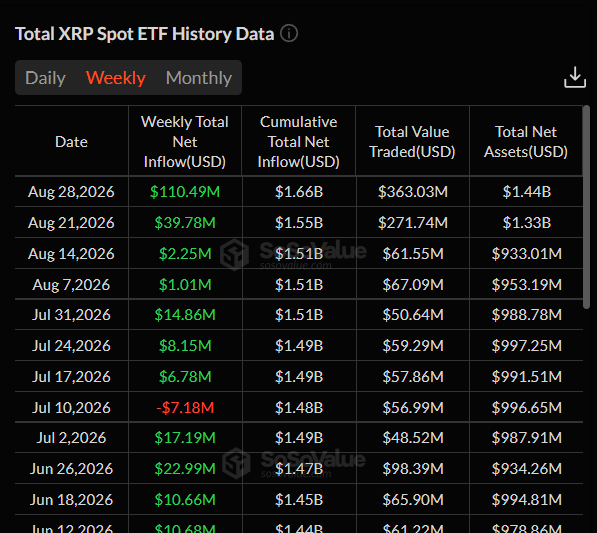
For the specific week ending August 28, spot XRP ETFs pulled in $110.49 million, their strongest single week of 2026. Cumulative ETF inflows since launch have also reached approximately $1.66 billion, with total net assets near $1.44 billion.
Bitwise’s XRP ETF remains the largest by cumulative inflows, topping $600 million, while Franklin’s XRPZ fund has also shown strong growth, though the specific figure cited for it appears to reflect cumulative inflows since launch rather than a single week, given it would otherwise exceed the total weekly inflow figure across all XRP ETFs combined.
However, ETF fund flows are only a small fraction of XRP’s roughly $87 billion market value, so they did not drive the price higher on their own. For context, May saw $131.94 million in ETF inflows, and XRP still fell that month.
Why the Rally Might Not Hold for XRP This September
In seven of the last eight years, XRP’s September has moved in the opposite direction from its August.
In five of the six years August finished lower, September finished higher. In the two years August finished higher, September finished lower both times, down 14% in 2020 and 19.6% in 2021.
| Year | August | September | Reversed? |
| 2018 | -22.9% | +73.4% | Yes |
| 2019 | -19.2% | -1.3% | No |
| 2020 | +8.4% | -14.0% | Yes |
| 2021 | +58.9% | -19.6% | Yes |
| 2022 | -13.6% | +46.3% | Yes |
| 2023 | -26.8% | +0.8% | Yes |
| 2024 | -9.1% | +8.0% | Yes |
| 2025 | -8.1% | +2.5% | Yes |
Source: ReturnsView. XRP monthly returns, 2018–2025.
Wallet data adds a second, more specific concern. The HODL Waves data, which sorts wallets by how long they have held a coin, shows real turnover during the rally.
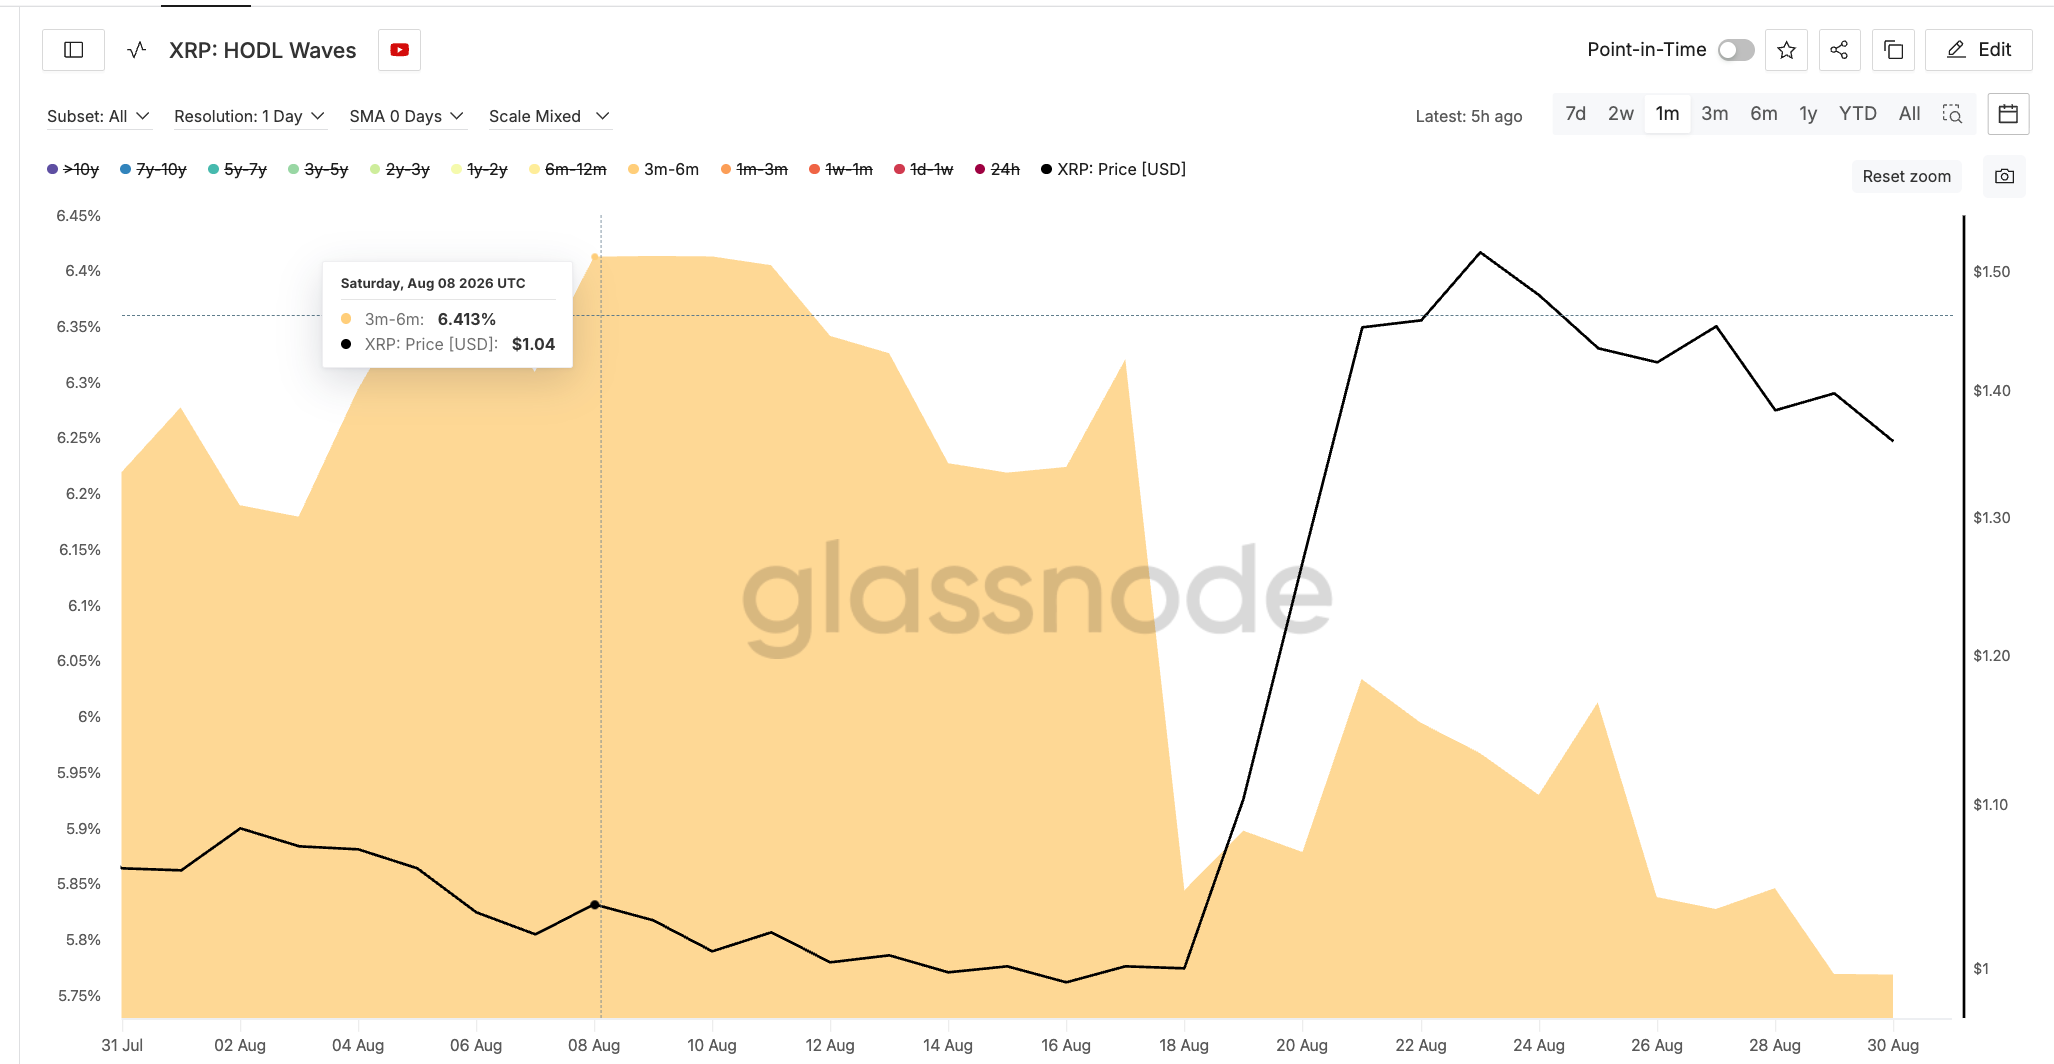
Wallets that had held XRP for three to six months, meaning coins bought roughly between March and May, saw their share of total supply fall from 6.41% on August 8 to 5.76% by press time, indicating this cohort sold into the rally.
Meanwhile, wallets holding for just one week to one month nearly doubled their share of supply, from 1.68% on July 31 to 3.22% currently, which lines up with the month’s heaviest buying volume occurring around the August 21 peak.
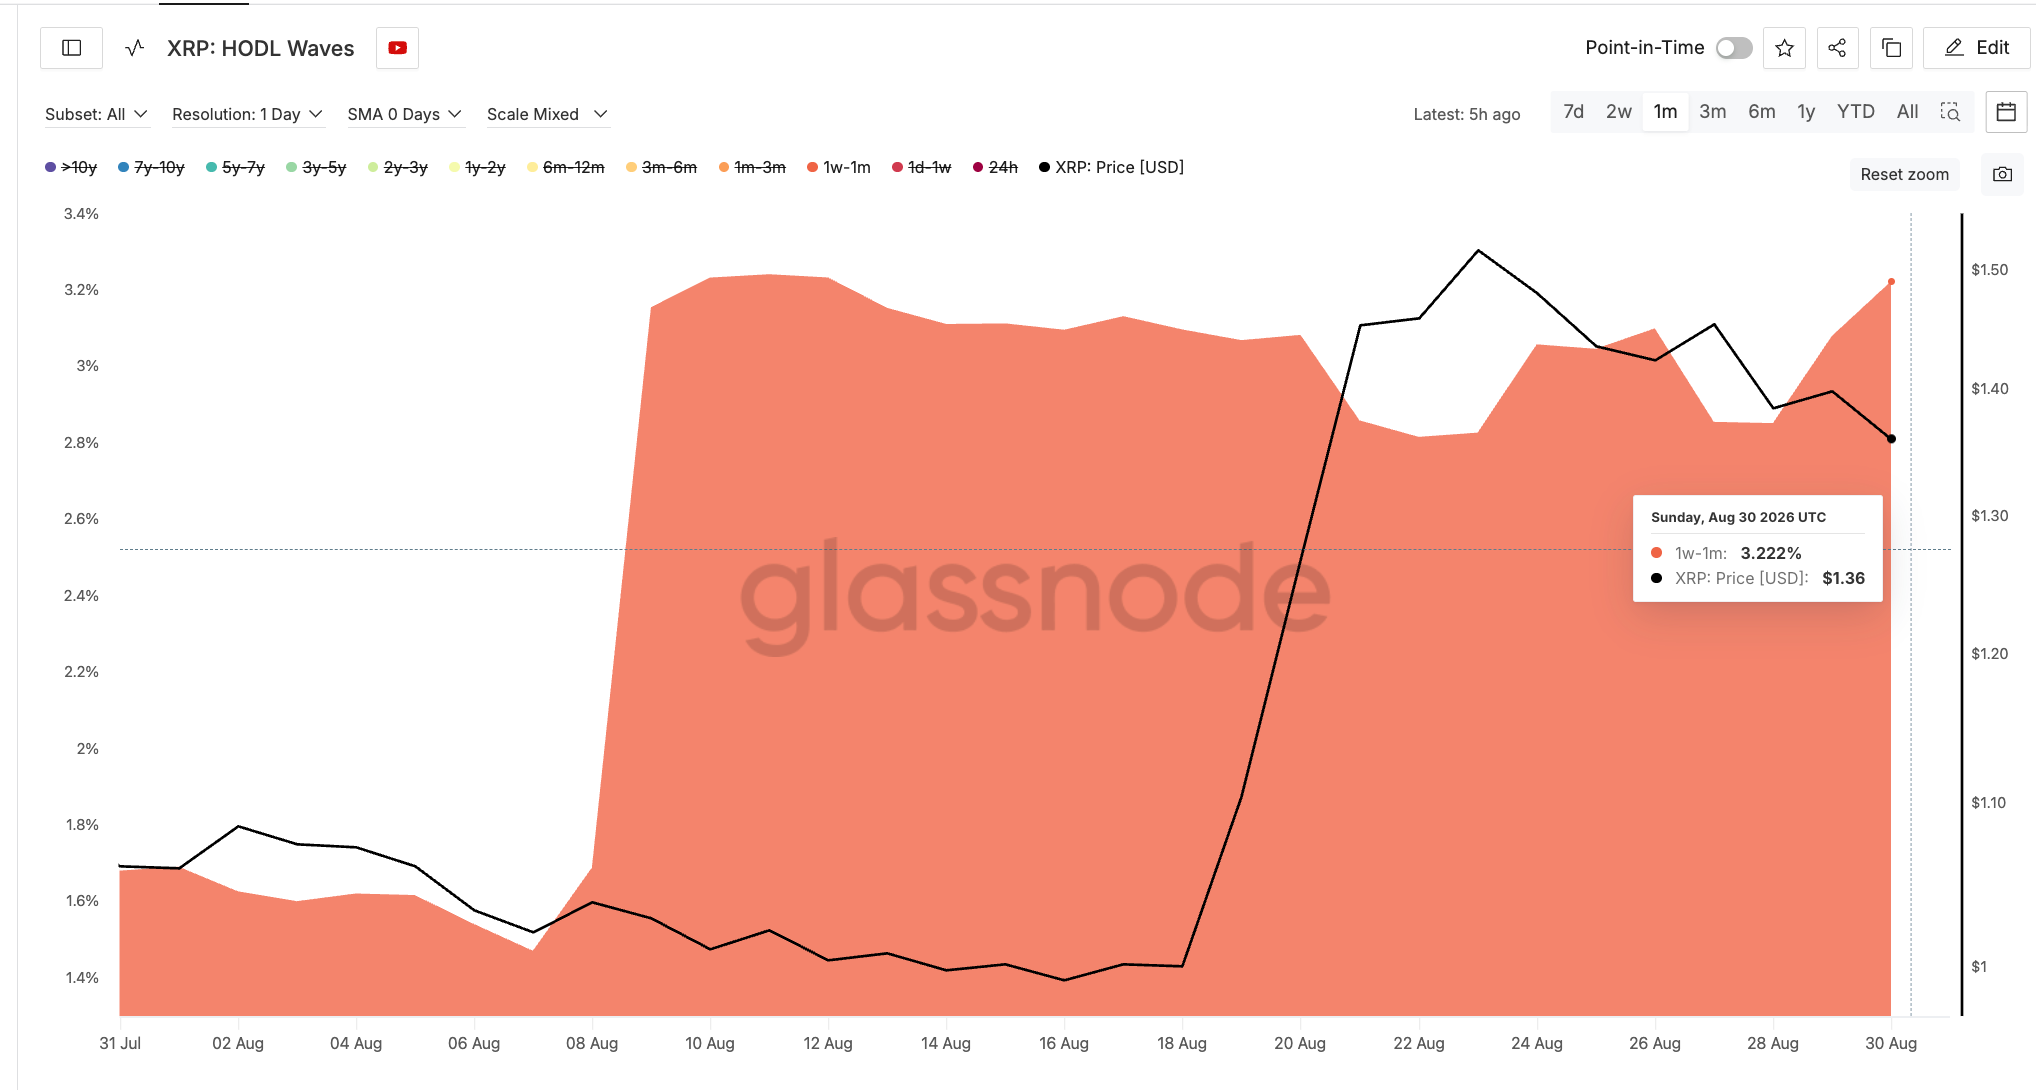
In effect, newer buyers appear to have absorbed coins that longer-term holders were selling.
The Bullish Case Getting Real Attention Too
On the positive side, crypto chart analyst Ali Martinez said on X that XRP’s breakout above a falling trendline is confirmed, setting a next target of $1.70.
Under his framework, the first hurdle sits near $1.50, and clearing that range would strengthen the case for reaching $1.70.
A break above $1.70 with strong buying could open $2.09 and then $2.35 as further upside targets.
The setup would weaken if XRP lost $1.37, a break he said could send the token toward $1.20.
Where the Key Price Levels Sit
XRP was trading near $1.3653 as of this writing. The cryptocurrency is currently inside a falling channel dating back to January, below its 200-period exponential moving average at $1.56.
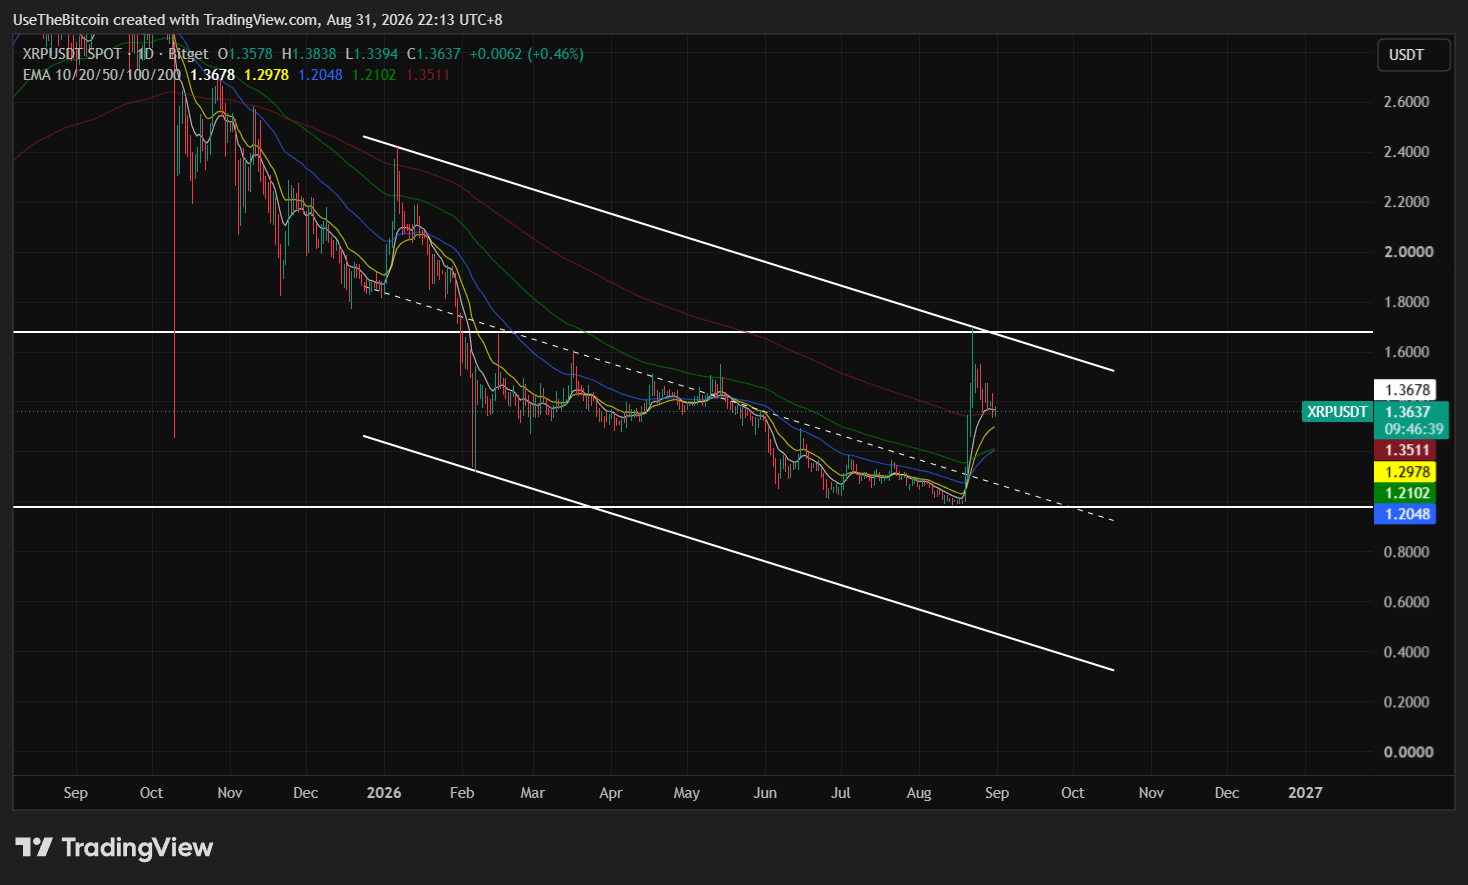
That framework identifies $1.34 to $1.36 as the most important zone to watch. Losing that zone would open $1.15, then $0.98 and $0.81, with a repeat of January’s pattern potentially reaching down toward $0.58. On the upside under this same framework, nothing meaningfully improves until XRP closes above $1.69 for two consecutive days.
Two Different September 15 Catalysts Worth Tracking Separately
The Federal Reserve will meet on September 15 and 16 with fresh economic projections, which is considered to be a potential make-or-break catalyst for broader risk appetite heading into the month.
Moreover, the US Senate is scheduled to hold its CLARITY Act cloture vote on September 15 as well, a bill that could establish clearer federal rules for digital assets including XRP specifically.
Overall, September’s outcome likely depends on which force wins out: XRP’s historical seasonal tendency to reverse a strong August, or the newer bullish signals around confirmed technical breakouts, record ETF inflows, and tightening exchange supply.
Whether the wallets that bought in the final two weeks of August turn out to be early accumulators or simply the last buyers before a pullback will become clearer as September’s own wallet and flow data develops.
This article is for informational purposes only and does not constitute financial advice. Crypto price predictions are based on analyst estimates and are not guarantees of future performance. Do your own research before making any investment decisions.
Frequently Asked Questions
Need a refresher? Here are the questions traders are asking about XRP heading into September.
Does XRP’s seasonal pattern guarantee a September decline?
No. The pattern has held in seven of the last eight years, but the source presenting this data is explicit that eight years is a small sample and that seasonality functions as a pattern worth watching, not a rule that determines outcomes.
Is XRP’s rally driven more by ETFs or by retail trading?
Neither fully explains it alone. ETF inflows of roughly $153 million in August are small next to XRP’s $87 billion market value, and May saw comparable ETF inflows without a price gain. Wallet data suggests much of the actual buying came from newer, shorter-term holders rather than ETF structures themselves, with ETF demand serving more as a supporting signal than the primary driver of August’s move.
What does it mean when ETF inflows rise while exchange reserves fall?
Together, those two trends point toward tightening supply on exchanges alongside growing institutional demand. Fewer coins sitting on exchanges means less immediately available supply to sell, so if buying pressure continues while that supply keeps shrinking, the price impact of new demand can become more pronounced than it would be with ample exchange supply on hand.
Is the CLARITY Act vote the same event as the Federal Reserve meeting on September 15?
No. These are two separate, unrelated events that happen to land on the same date. The Federal Reserve meeting concerns broader monetary policy, while the CLARITY Act vote concerns digital asset regulation specifically.
What does the wallet turnover data suggest about the August rally’s sustainability?
Wallets that had held XRP for three to six months reduced their share of supply during the rally, while much newer wallets holding for one week to one month nearly doubled their share. That pattern suggests longer-term holders sold into strength while newer buyers absorbed those coins, a dynamic some analysts see as a caution sign based on a similar pattern preceding a prior XRP decline.