- Bitcoin seeks to consolidate while waiting for Ethereum to take over.
- ETH/BTC may improve against the long-term trend.
- XRP seems incapable of capitalizing on good news.
Meanwhile, the focus is on Facebook’s initiative named “Libra.” The project will offer a Stablecoin linked to any main currency – Dollar or Euro perhaps – and that counts on the collaboration of big players companies.
It is always crucial for new technologies to be adopted by major players in the industry, but it is not clear what benefit this launch can have for users unless the ultimate goal is to offer the same services provided today by Bank of America or HSBC.

ETH/BTC Daily Chart
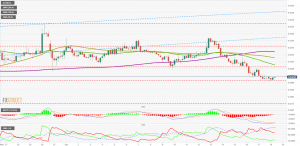
ETH/BTC may have a good day given the short-term indicator profile. After a long decline from the 0.0322 level to the current 0.0292 – where it has found support – it is set to turn bullish in the short term. In the medium and long-term, the trend continues to be bearish.
The pair is trading at 0.0293, and its first resistance level is at 0.0301 (price congestion resistance). The second resistance level is at 0.0308 (confluence of the EMA50, SMA100, and SMA200 the third resistance level at 0.0316.
Below the current price, the first support level is at 0.0275 (price congestion support), then the second at 0.0268 (price congestion support) and the third one at 0.0252 (price congestion support and relative minimum price).
The MACD on the 4-hour chart shows a bullish cross profile for the next few hours.
The DMI on the 4-hour chart shows the great advantage that bears have over bulls, which try to react to the upside from minimum levels not seen since mid-May where I mark the relative lows.

BTC/USD Daily Chart
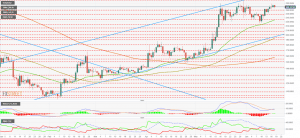
Bitcoin is currently trading at $9,222 after a rather busy European morning with $9,000 level testing included.
Can BTC/USD continue to evolve upwards without being accompanied by the main Altcoins? – It is hard to imagine that. It is for this reason that the next few hours, and especially Ethereum’s behavior against Bitcoin are so important.
Above the current price, the first resistance level is at $9,650 (price congestion resistance), then the second at $10,650 and the third one at$11,370.
Above this last resistance level, Bitcoin has few technical obstacles so that the uptrend could accelerate.
Below the current price, the first support level is at $9,150 (price congestion support), then the second at $8,825 (price congestion support) and the third one at $8,450 (price congestion support). There is no change of scenario if the BTC/USD pair does not lose the critical level at $8,130.
The MACD on the daily chart shows the cross indicator rising but with possible weakness in the short term, and it is possible that a different structure will form downwards.
The DMI on the daily chart shows bulls with a clear advantage over bears and a structure that may lengthen the bullish scenario in the medium term.

ETH/USD Daily Chart
Ethereum is currently trading at $269 after closing yesterday at $273.95 – a new relative high.
ETH/USD is having trouble crossing the gap between the first support line at $260 and the first resistance at $290. The clear objective is on the upside, but it may need some time to form support in the current area that will allow it to attack the high side of the range.
Above the current price, the first resistance level is at $290 (price congestion resistance), then the second at $305 (price congestion resistance), and the third one at $315 (price congestion resistance). As we can see from the chart, at this last resistance level the ETH/USD pair would meet the mid-term bullish channel ceiling.
Below the current price, the first support level is at $260 (price congestion support), then the second at $250 (price congestion support) and the third one at $238 (price congestion support).
The MACD on the daily chart shows very clearly what I have explained in the BTC/USD analysis. The averages point upwards but with so little inclination and separation between lines – a sign of weakness.
The DMI in the daily chart shows bulls with a small advantage over bears. More importantly, the bullish side of the market moves above the ADX line, providing hope to the bulls.

XRP/USD Daily Chart
The XRP/USD pair is trading at $0.44 hitting a high of $0.462 on Monday following the announcement of an agreement with MoneyGram to use Ripple’s technology in its multimillion-dollar business.
Above the current price, the first resistance level is at $0.467 (price congestion resistance), then the second at $0.050 (price congestion resistance). The third one is $0.528 (price congestion resistance).
Below the current price, the first support level is $0.437 (price congestion support), then the second support level is $0.428 (price congestion support), and the third one is $0.413 (price congestion support).
The MACD on the daily chart shows the same weak profile as Bitcoin and Ethereum. The development of the price in the next few days may determine the medium-term scenario.
The DMI on the daily chart shows bulls significantly ahead of bears. The buyer side moves above the ADX – further reinforcing the bullish side. The bears seem to be finally defeated and looking for lower levels.


