Key Takeaways
- Bitcoin TD Sequential flashes a sell signal as the price struggles to trade higher, with a potential decline imminent.
- Crypto experts share their previous reactions to TD Sequential sell orders, which showed a 7% and 13% decline, respectively.
- BTC’s price must defend the key zone of $117k to prevent a crash in the coming days if it trades around this area.
A few days ago, the price of Bitcoin was trading at an all-time high of $126,500, with speculations suggesting the market could rally towards a key high of $130,000 this week. However, things haven’t turned out as expected, as the price continues to struggle following its price rejection from its previous high.
While crypto experts and traders suggest this could be a minor price crash towards a key low of $120,500, there is a potential for price continuation to the upside to $150,000, as Q4 historically has always favored BTC and altcoins.
A price action that was spot on based on speculation with price gaining over 5% in the first few days of October with “Uptober” narrative making the waves in the crypto space has gained a new twist as crypto expert Ali Martinez speculate the price of Bitcoin could trade into lower price region of $117,000 following recent emergence of TD Sequential flashing a sell signal on the BTC daily chart.
Ali Martinez Speculation of Dump for Bitcoin

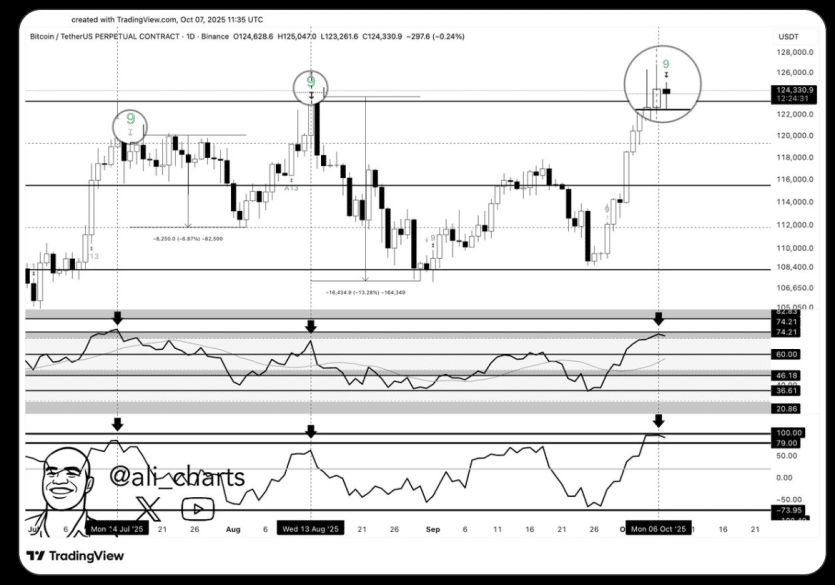
Source – Ali Martinez Daily Bitcoin TD Sequential Chart
While the crypto market is buzzing with speculation of BTC reaching new highs of $150,000 in recent days, Ali Martinez, who tweets on BTC analysis, took to his X account to analyze the current market trend. The crypto expert suggests some caution is needed based on the current BTC daily chart.
According to the crypto expert, the price of BTC on the daily timeframe has flashed a sell signal based on its TD Sequential indicator. Historical data have shown that previous bearish signs led to market crashes of around 7% and 13% for BTC in July and August, respectively.
He further stated that while we do not know the extent of a potential market crash in the coming days or weeks, the BTC RSI and the ChandeMO appear exhausted, as Bitcoin’s price is not accompanied by strong volume to the upside.
This price speculation has caused the price of BTC to struggle in the last few days, as it could potentially trade into its key support zone around $119,000 to $117,500, where strong bullish price action could develop.
Despite recent price struggles, overall market sentiment and price action for BTC remain bullish, with the price on course for a potential rally towards an all-time high of $130k to $150k, according to price predictions.
FAQs
What is TD sequential?
TD Sequential is a trading indicator used to spot trend reversals in the financial market.
Is TD sequential good for crypto trading?
There are many indicators available based on preference in the trading community, and TD Sequential has been used to spot trend reversals.
What is the most accurate BTC indicator?
Bitcoin does not have a fixed indicator because several indicators are based on its use and application for pricing.
Related Read


