
Ethereum enters October 4 trading near $2,680 after another unsuccessful attempt to sustain its recovery above $2,800, leaving ETH caught between weakening short-term institutional demand and increased activity from large holders.
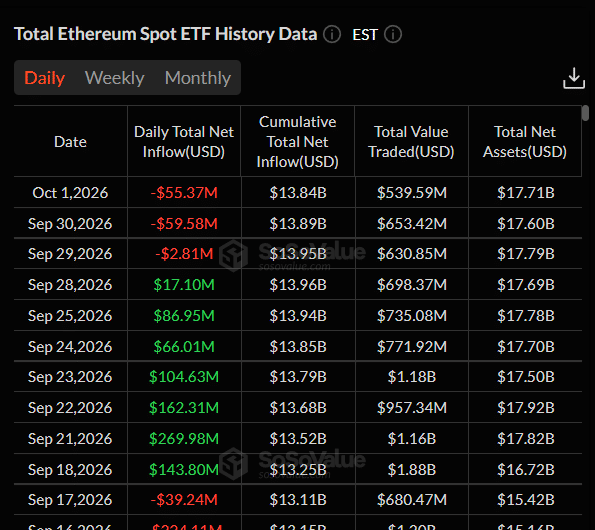
Meanwhile, US spot Ethereum exchange-traded funds (ETFs) recorded about $118 million in net outflows across three trading sessions ending October 1, interrupting the stronger demand seen in September.
Despite the selling pressure, onchain data suggests some investors are accumulating Ethereum. The network’s upcoming Glamsterdam upgrade also provides a development catalyst, with activation on the Sepolia testnet scheduled for October 6.
For now, $2,645 remains the immediate downside level to defend, while a confirmed breakout above $2,775 to $2,800 is needed before the broader $3,000 target becomes more realistic.
Ethereum Struggles to Break the $2,800 Resistance
Ethereum has repeatedly approached $2,800 without establishing sustained support above the level.
The latest rejection followed a recovery that carried ETH from its June low near $1,516 to a recent high of approximately $2,806. At $2,680, Ethereum remains well above its summer lows but has lost momentum near the upper end of its September trading range.
Immediate resistance sits between $2,750 and $2,775, followed by the tougher $2,800 to $2,825 region.
A sustained daily close above $2,825 would reopen the path toward $3,000. If momentum strengthens beyond that psychological level, $3,400 becomes a longer-range reference from Ethereum’s January high.
On the downside, $2,645 is the first important support. Losing that area would weaken the current consolidation and bring $2,600 into focus, followed by the broader $2,445 to $2,500 technical support region.
| Ethereum Level | Role |
| $2,750-$2,775 | Immediate resistance |
| $2,800-$2,825 | Major breakout zone |
| $3,000 | Psychological resistance |
| $3,400 | Higher resistance reference |
| $2,645-$2,660 | Immediate support |
| $2,600 | Secondary support |
| $2,500 | Major support |
| $2,445-2,460 | Deeper technical support |
Table 1. Ethereum Key Support and Resistance Levels
Ethereum ETFs Record $118 Million in Three-Day Outflows
Institutional demand has weakened in the first few days of October. US spot Ethereum ETFs recorded approximately $118 million in net outflows across three trading sessions ending October 1. ETH subsequently closed around $2,670 on October 2, its lowest closing price since September 20.
Bitcoin ETFs attracted inflows during the same period, showing that recent institutional demand has not been equally distributed across the two largest cryptocurrencies.
However, the broader Ethereum ETF picture remains positive.
The funds attracted about $832 million in September, after roughly $1.82 billion in August. Their cumulative net inflows reached approximately $13.8 billion, according to figures reported on October 3.
The immediate concern is whether October’s withdrawals continue while ETH tests $2,645. Renewed ETF inflows would help buyers absorb supply around $2,775 to $2,800, but continued redemptions could make that resistance harder to reclaim.
Whale Activity Increases as Exchange Supply Declines
Ethereum’s onchain activity presents a different picture from the recent ETF withdrawals.
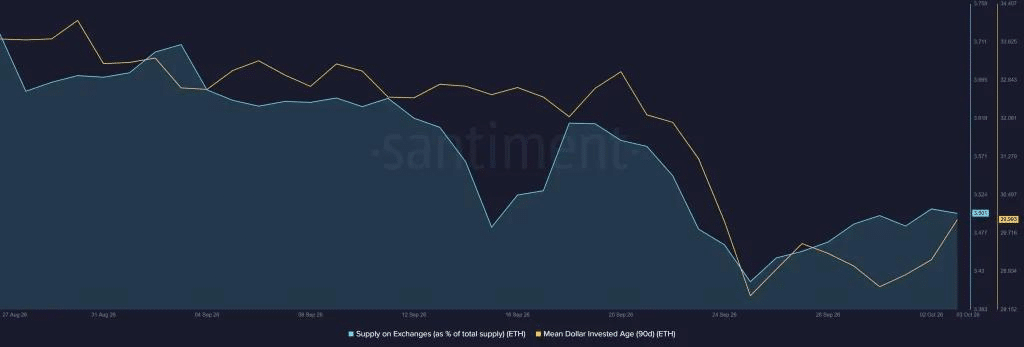
Large transactions have increased as ETH approaches $2,800, while previously inactive wallets have started moving coins again.
Recent activity includes an early Ethereum ICO-era wallet reportedly acquiring approximately 8,492.8 ETH for $23.7 million near $2,794. Another large wallet accumulated around 1,486 ETH, worth approximately $4 million, near $2,710.
Together, these reported purchases represent nearly 10,000 ETH, although they should not be interpreted as evidence of broader institutional buying.
Exchange-flow data also showed approximately $3.20 billion worth of ETH withdrawn against $1.34 billion deposited during the 30-day period through October 1, representing an estimated net exchange outflow of $1.86 billion.
A declining exchange balance can reduce the amount of ETH immediately available for spot selling, although withdrawals do not automatically prove long-term accumulation. They can also reflect custody transfers, staking, and other operational activity.
The combination of increased large-holder activity and reduced exchange supply offers potential support, but buyers still need to show demand can overcome selling near $2,800.
Glamsterdam Testnet Launch Scheduled for October 6
Ethereum’s next major network upgrade is approaching an important testing milestone.
The Ethereum Foundation has confirmed that Glamsterdam is scheduled to activate on the Sepolia testnet on October 6, 2026, at 13:53:36 UTC.
The upgrade includes enshrined proposer-builder separation (ePBS), block-level access lists (BALs) and changes to gas pricing designed to improve Ethereum’s Layer 1 efficiency and scalability.
Importantly, October 6 is a testnet deployment, not the mainnet launch. Hoodi and mainnet activation dates have not yet been confirmed.
For ETH, the testnet provides a near-term development event that could attract market attention, particularly if the upgrade proceeds smoothly.
However, a successful Sepolia activation would demonstrate technical progress rather than automatically creating additional demand for ETH. A sustained price recovery would still require buyers to reclaim $2,800 while broader market conditions remain supportive.
Ethereum Staking and DeFi Activity Continue Growing
Ethereum’s underlying network activity remains relatively strong despite the recent price consolidation.
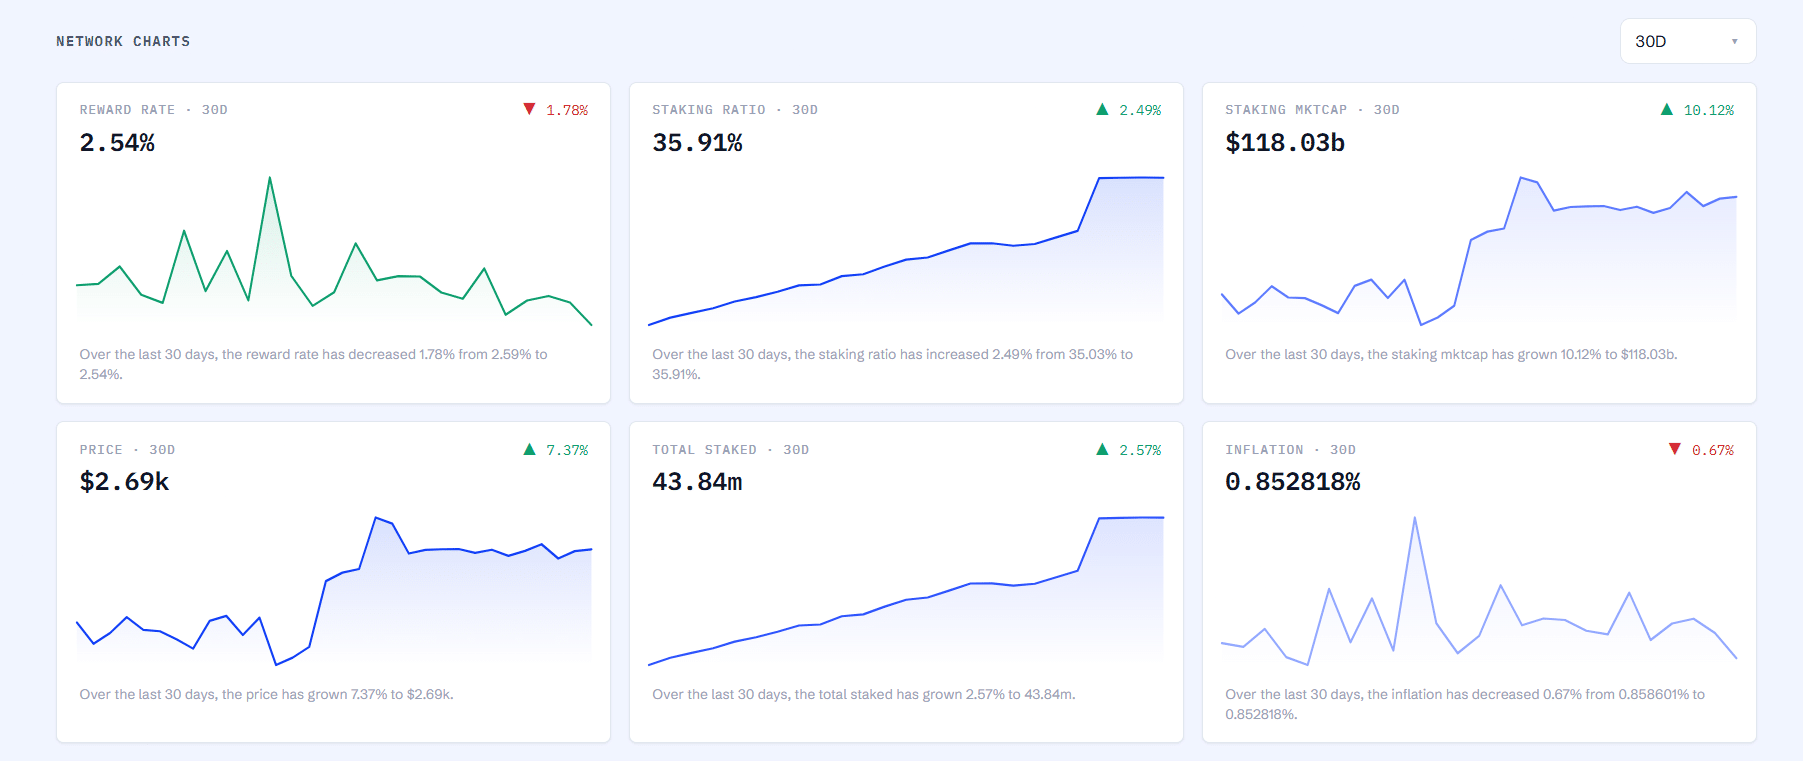
The proportion of ETH committed to staking has reportedly climbed above 35%, with the recorded value of staked assets exceeding $119 billion, according to Staking Rewards data.
Meanwhile, total value locked (TVL) across Ethereum’s DeFi ecosystem rose from about $39 billion in June to $54 billion in early October.
Staking can reduce immediately liquid supply because participating ETH is committed to network validation or related staking products. However, those balances are not necessarily removed from circulation permanently.
Growing DeFi TVL also reflects more capital in Ethereum-based financial applications, although some of the dollar-denominated increase can come from changes in asset prices.
Both indicators support the broader ecosystem outlook, but immediate price direction still depends on ETH defending support and attracting enough demand to clear its current resistance.
Ethereum’s Golden Cross Keeps the Broader Recovery Intact
Ethereum’s daily technical structure remains stronger than its recent short-term performance suggests.
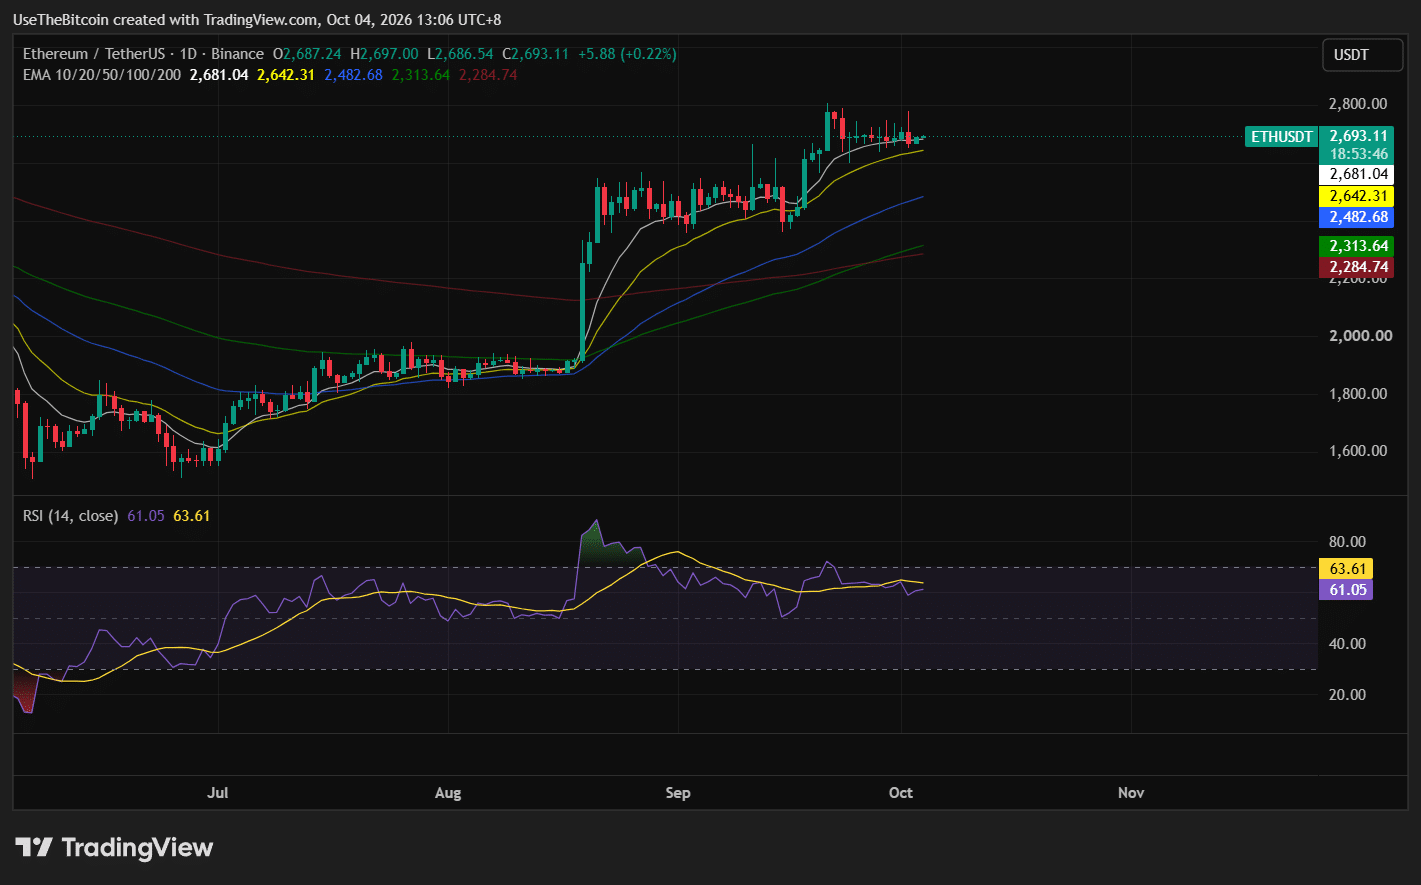
The 50-day exponential moving average (EMA) moved above the 200-day EMA on September 6, completing a golden cross during the recovery from June’s lows.
However, a golden cross is a lagging indicator. It reflects the strength of an existing recovery rather than guaranteeing that prices will immediately continue higher.
With Ethereum repeatedly failing around $2,800, the more important confirmation would be a daily breakout above $2,825.
A sustained close below $2,645 would instead increase the risk of ETH testing $2,600 and potentially the stronger $2,445 to $2,500 region.
| Scenario | What Would Support It | Levels to Watch |
| Bullish Case | ETH defends $2,645 and closes above $2,825 with stronger demand | $3,000, then $3,400 |
| Base Case | ETH holds $2,645 but continues struggling below $2,800 | $2,645-$2,800 consolidation |
| Bearish Case | ETH closes below $2,645 as ETF outflows persist | $2,600, then $2,445-$2,500 |
Table 2. Ethereum Bullish, Base and Bearish Scenarios
Bottom Line
Ethereum enters October 4 near $2,680, with $2,800 still limiting its recovery.
The immediate support to defend is $2,645. Holding that level would keep ETH positioned for another attempt at $2,775 to $2,825, while a confirmed breakout above the resistance zone would make $3,000 the next major target.
A sustained break below $2,645 would weaken the short-term structure and expose $2,600, followed by the broader $2,445 to $2,500 support area.
This article is for informational purposes only and does not constitute financial advice. Crypto price predictions are based on analyst estimates and are not guarantees of future performance. Do your own research before making any investment decisions.
Frequently Asked Questions
Need a refresher? Here are the questions most readers ask about Ethereum’s current price setup and October outlook.
What Is Ethereum’s Main Resistance Right Now?
Ethereum faces immediate resistance around $2,750 to $2,775, followed by the more important $2,800 to $2,825 region. A sustained daily close above that zone would bring $3,000 into focus.
What Is Ethereum’s Main Support?
The first important support is around $2,645 to $2,660. A sustained break below it would expose $2,600 and potentially the broader $2,445 to $2,500 technical support region.
Why Are Ethereum ETFs Recording Outflows?
US spot Ethereum ETFs recorded approximately $118 million in net outflows across three trading sessions ending October 1, indicating weaker demand after September’s stronger inflows. The data alone does not establish a single cause for the withdrawals.
When Is the Ethereum Glamsterdam Upgrade?
Glamsterdam is scheduled to activate on the Sepolia testnet on October 6, 2026, at 13:53:36 UTC. Its mainnet activation date remains unconfirmed.
Can Ethereum Reach $3,000 in October?
Ethereum would first need to defend $2,645 and establish a sustained breakout above $2,800 to $2,825. Renewed ETF inflows and continued spot accumulation could support that scenario, but $3,000 remains a conditional upside target rather than a confirmed outcome.