XRP traded below $1.09 on July 28, 2026, sitting below every major moving average on the daily chart, with $1.14 standing as the first of three EMAs the token needs to clear and hold above before its year-long downtrend can be called over.
Inside XRP’s Stalled Recovery
XRP is down roughly 66% over the past year and has traded below its 200-day EMA since January 2026, putting it seven months into a downtrend by the definition most traders use, that EMA sloping downward with price consistently beneath it.
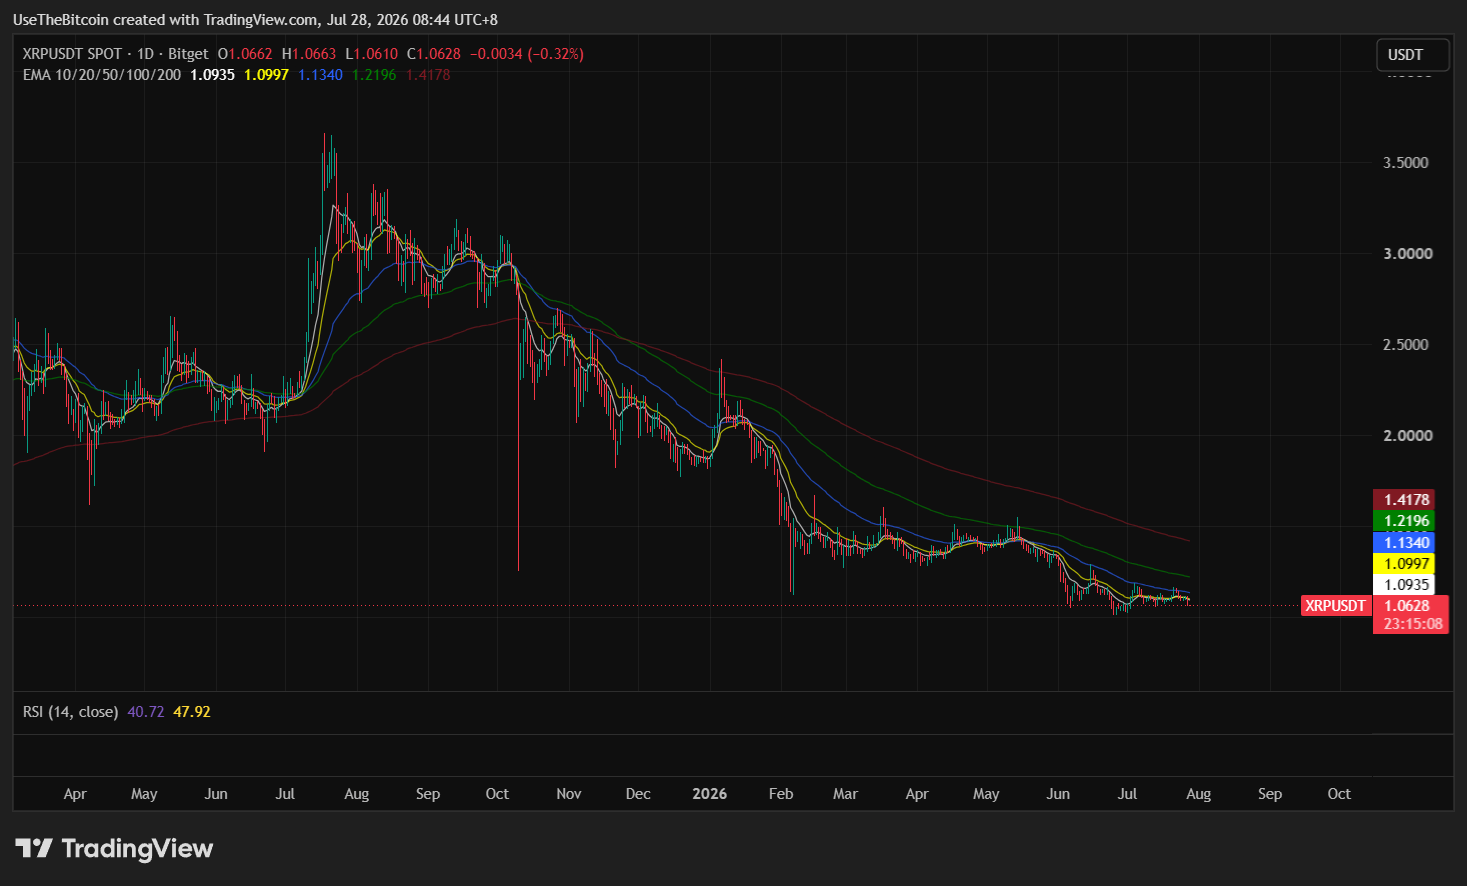
The token briefly reached $1.16 intraday on July 21 before closing at $1.14, repeated that close the next day, then slipped to $1.11 and hasn’t closed above $1.14 since.
An earlier attempt to sustain a breakout also lost momentum around $1.16 the prior Tuesday, reinforcing how consistently this resistance zone has capped upside attempts in recent weeks.
Clearing a moving average requires a daily close above it followed by several sessions holding there, not just an intraday touch, which is why XRP’s recent attempts haven’t counted as a break.
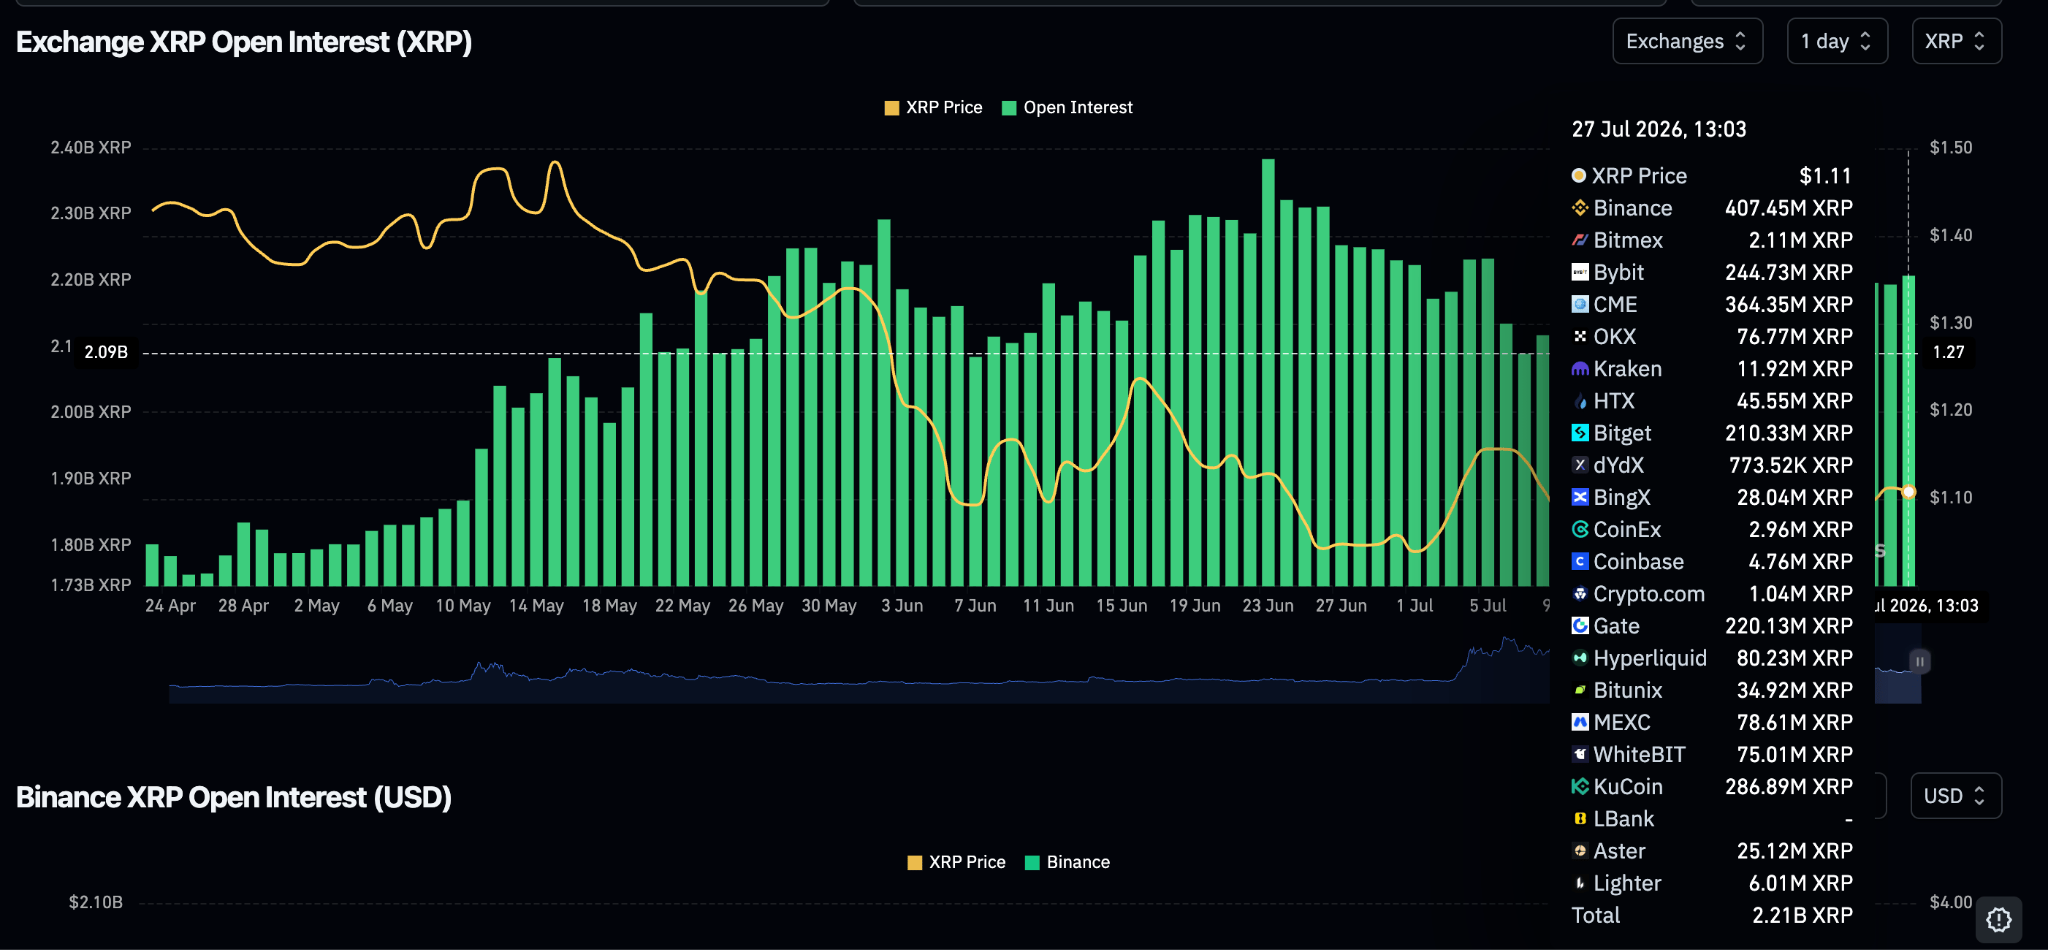
Institutional demand has cooled alongside the technical picture. XRP perpetual futures open interest sat at 2.21 billion XRP on Monday, up slightly from 2.19 billion the prior day, stabilizing after a drop to 2.37 billion on July 20, according to CoinGlass data.
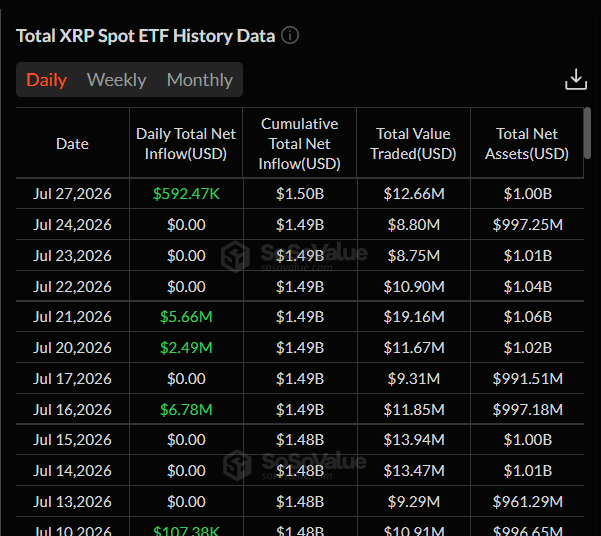
Spot XRP ETF activity also stayed muted through Wednesday, Thursday, and Friday last week, with cumulative inflows averaging $1.49 billion and net assets under management at $1.01 billion, according to SoSoValue, suggesting existing holders are staying in for the longer term even as new demand has stalled.
Separately, geopolitical tensions eased over the weekend after President Trump paused military action against Iran and Iran suspended strikes on US military bases in the region, with oil prices dropping sharply on Monday as a result.
What the Indicators Show for XRP
Momentum readings are flat rather than pointing firmly in either direction. Daily RSI sits in the mid-to-high 40s, neutral territory that’s neither oversold enough to attract mean-reversion buyers nor strong enough to signal a rebuild. The daily MACD is essentially flat, pointing to a lack of real energy in the market at the daily timeframe.
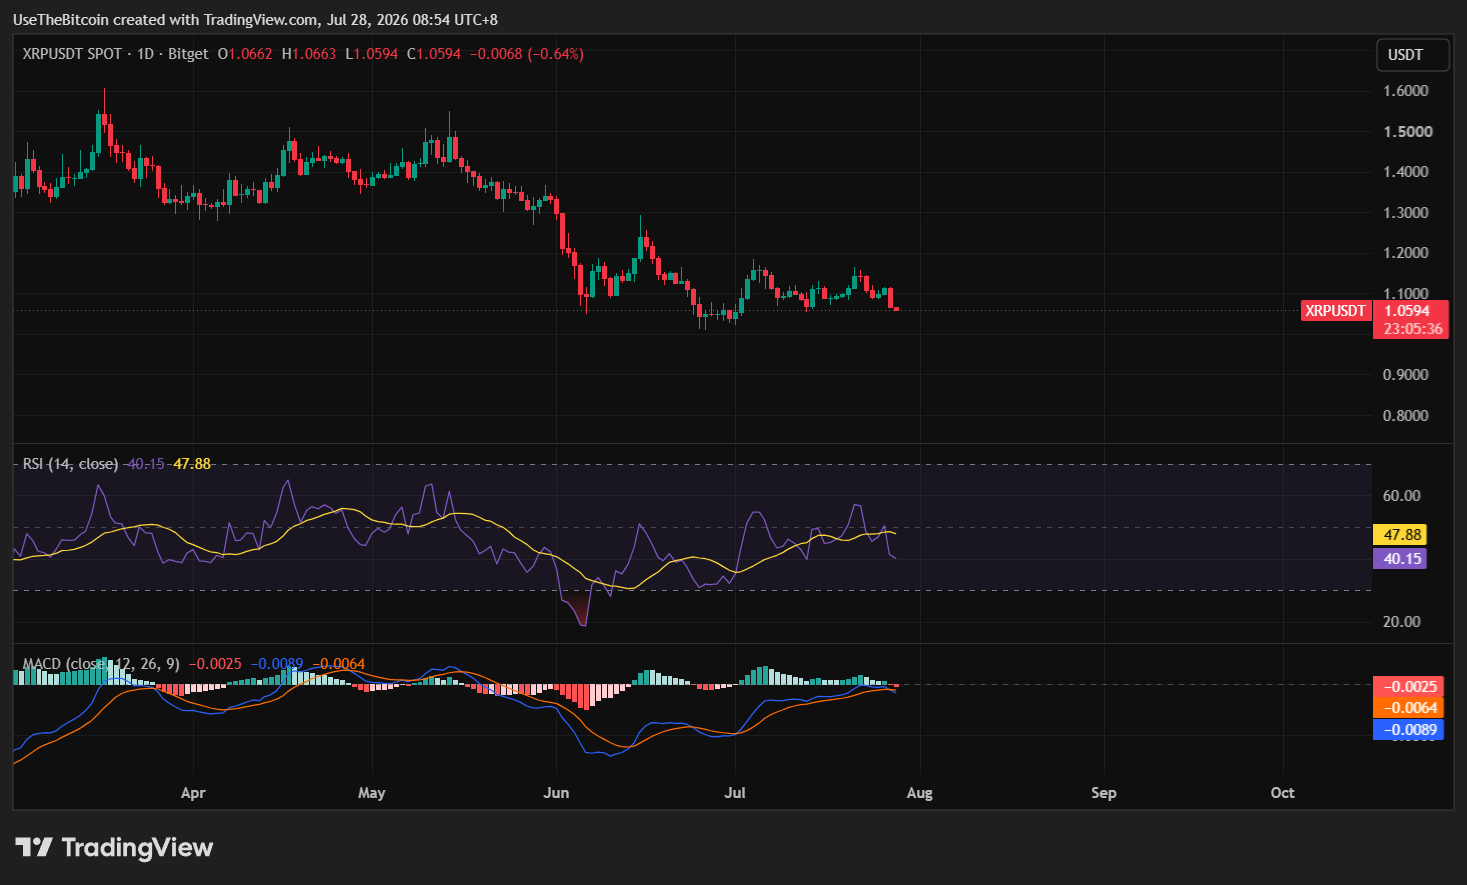
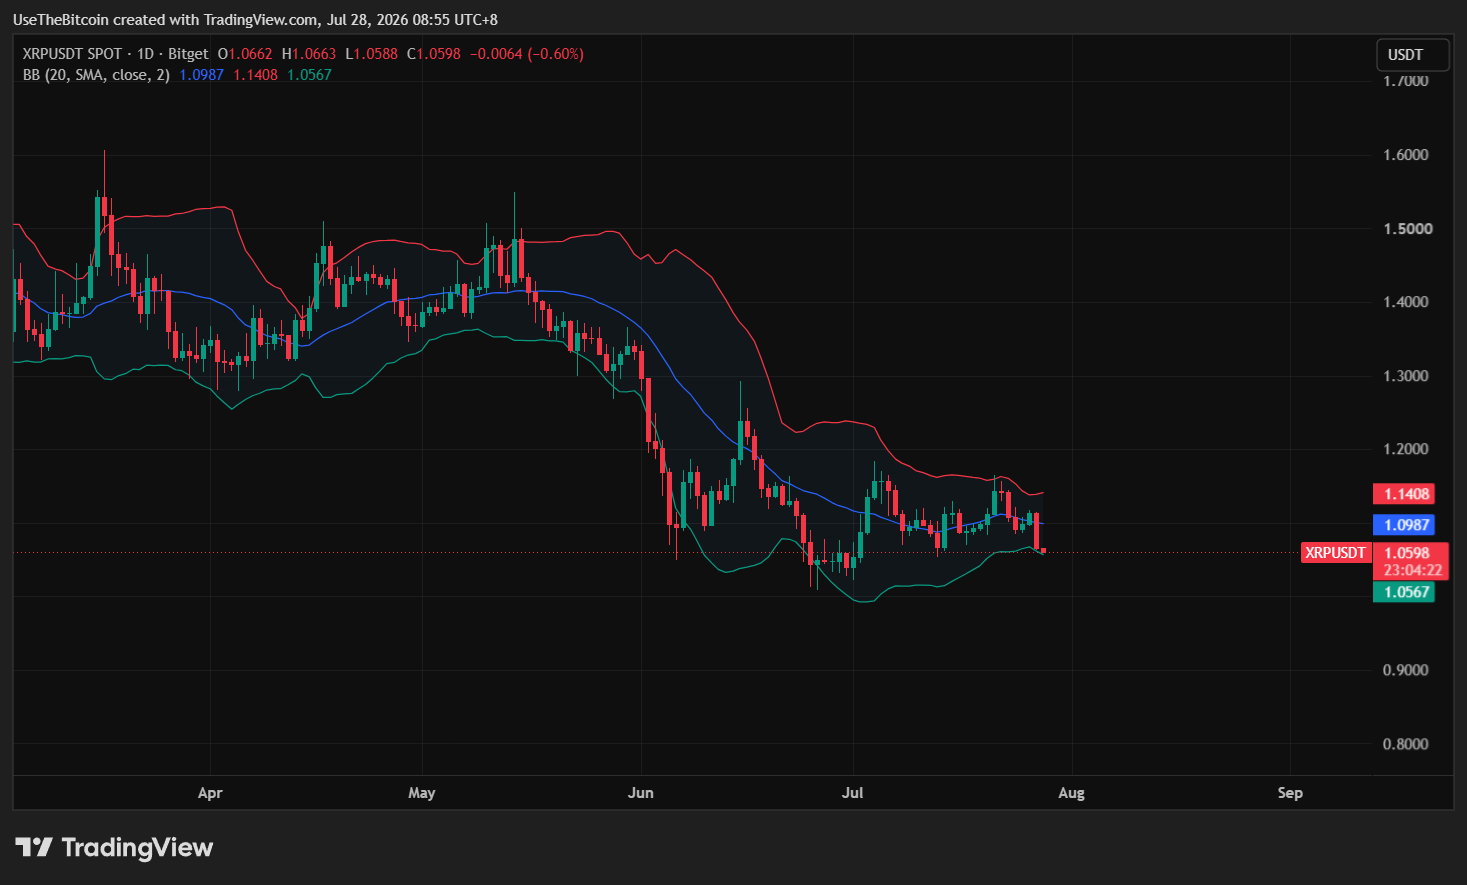
Daily Bollinger Bands frame a tight range, with the midline near $1.10, upper band near $1.14, and lower band near $1.07, and daily average true range sitting around $0.03, confirming how little the price has moved session to session lately.
Moving to shorter timeframes, the hourly and 15-minute RSI readings have dropped into oversold territory, with price breaking below the hourly Bollinger Band, but the MACD stayed flat, meaning oversold conditions haven’t attracted the buying conviction that would normally accompany a bounce.
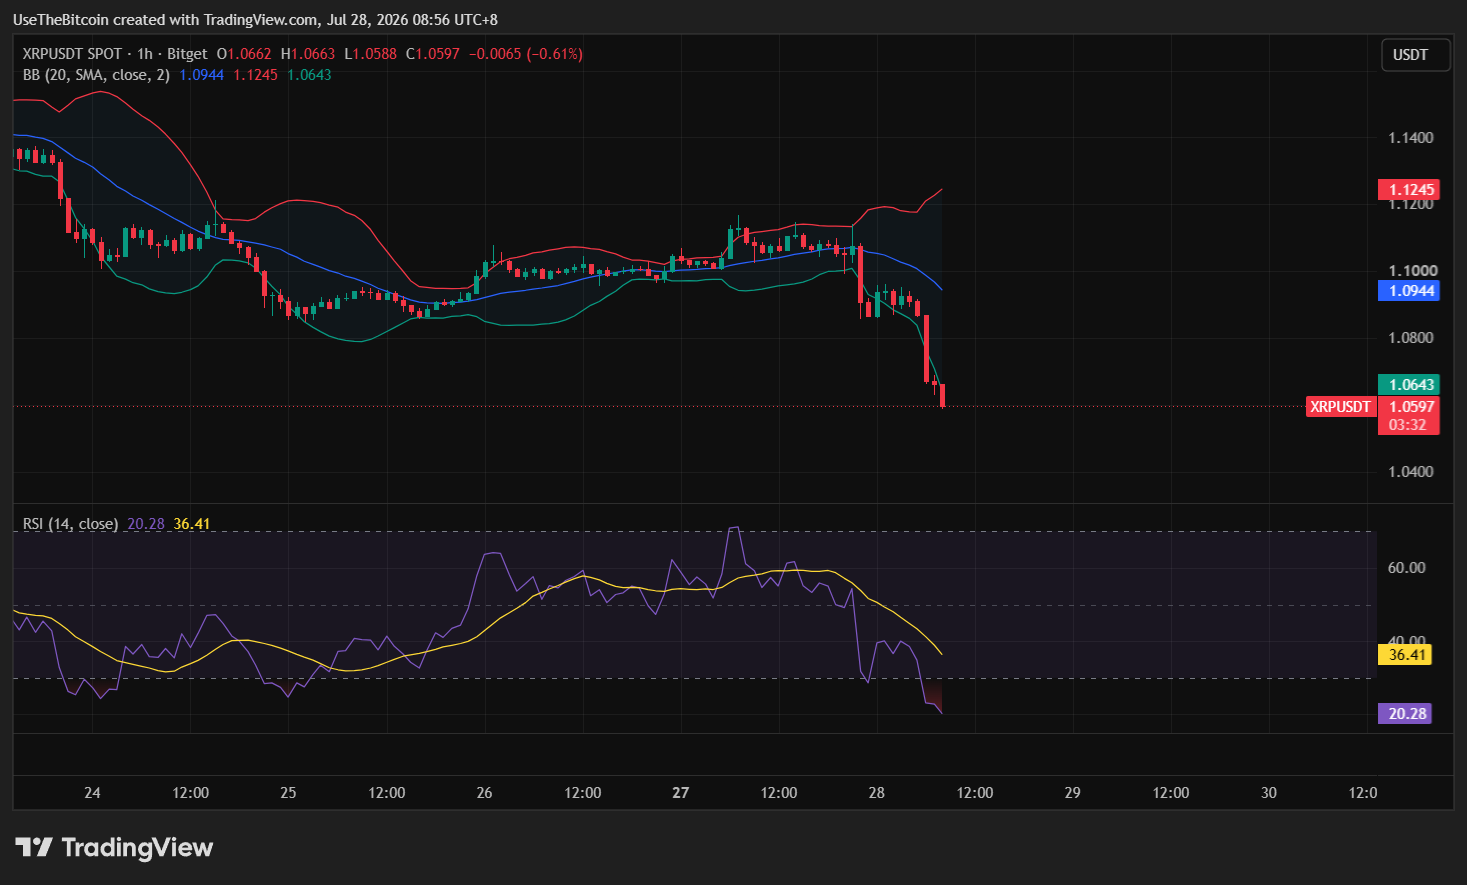
Low-volatility compressions tend not to last, and when they eventually break, the resulting move is typically larger and faster than the quiet trading beforehand would suggest.
The Three Levels That Matter for XRP
Clearing $1.14, the 50-day EMA, would only show XRP’s short-term trend has stopped falling, since the broader downtrend would still be intact above it.
That’s a 4% climb from current levels. The 100-day EMA at $1.22 carries more weight, since it covers roughly five months of trading, including June’s decline to $1.009, and a sustained move above it would mean the market had undone that entire drop, an additional 7% climb past the first level.
The 200-day EMA at $1.42 to $1.44 is the level traders treat as the actual dividing line between a bull and bear market, requiring a 29% climb from current prices to reach. Because moving averages shift at the pace of the sessions feeding them rather than the pace of price itself, clearing all three in a single sharp rally wouldn’t flip the stack immediately, the averages would still take time to catch up, meaning ending this downtrend requires months of sustained trading above these levels rather than one strong week.
| Level | Role | Notes |
| $1.01 | Deeper support | 100% Fibonacci retracement level |
| $1.009 | Historical reference | June 26 low, XRP’s closest brush with $1 since November 2024 |
| $1.07–$1.08 | Immediate support | Daily S1 pivot and lower Bollinger Band |
| $1.10–$1.11 | Decision zone | Daily pivot and short-period EMA, current trading range |
| $1.14 | First major resistance | 50-day EMA across sources, also the 78.6% Fibonacci retracement and daily upper Bollinger Band |
| $1.22 | Second resistance | 100-day EMA |
| $1.24 | Additional resistance | 61.8% Fibonacci retracement |
| $1.42–$1.44 | Long-term resistance | 200-day EMA, the dividing line between bull and bear market by this measure |
For readers tracking the institutional side of XRP’s setup specifically, our coverage of XRP ETF inflows and the CLARITY Act both track related developments shaping XRP’s regulatory and investment backdrop.
Bottom Line for XRP
The bullish case requires reclaiming $1.10 to $1.11 on a closing basis, with a push toward $1.14 needed to open any real conversation about a relief rally, a scenario that also depends on broader crypto sentiment stabilizing and Bitcoin dominance leveling off.
The bearish case is simpler and currently better supported given the daily trend remains broken with every major moving average acting as resistance overhead.
A daily close below $1.08 would expose deeper support near $1.01, while reclaiming $1.12 convincingly would invalidate the near-term bearish setup.
With volatility historically low across every timeframe right now, the eventual resolution of this compression is likely to move faster than the current quiet trading would suggest.
This article is for informational purposes only and does not constitute financial advice. Crypto price predictions are based on analyst estimates and are not guarantees of future performance. Do your own research before making any investment decisions.
Frequently Asked Questions
Need a refresher? Here are the questions traders are asking about XRP.
What is keeping XRP below $1.14?
XRP has repeatedly touched the $1.14 zone intraday without closing above it and holding there. Clearing a moving average requires a sustained daily close, not just a brief spike, and demand has consistently faded near this level over the past several sessions.
What would confirm XRP’s downtrend is over?
Traders generally treat the 200-day EMA, currently around $1.42 to $1.44, as the real dividing line between a bull and bear market. Reaching it isn’t enough on its own, since XRP would need to hold above all three EMAs for months, not just one strong week, given how slowly these averages adjust to new price action.
Why did XRP’s ETF inflows stay flat this week even as futures activity picked up?
Spot ETF activity stayed muted for several sessions even as futures open interest edged higher, a split that suggests existing long-term holders aren’t adding new money while short-term futures traders remain more active. That combination points to cautious rather than confident positioning overall.
How much would XRP need to rise to end its year-long downtrend?
Based on current levels, XRP would need to climb about 29% to clear its 200-day EMA, with the first, smaller hurdle at the 50-day EMA requiring roughly a 4% move and the 100-day EMA requiring a further 7% beyond that.
Is the easing of Iran-related tensions helping XRP right now?
The de-escalation has helped broader risk sentiment and pulled oil prices lower, but XRP-specific demand remains the bigger constraint. Easing macro tension alone hasn’t been enough to offset muted ETF activity and a technical setup still capped by falling moving averages.