
Bitcoin traded near $64,600 on July 30, 2026, after briefly dipping to $62,383 following the Federal Reserve’s rate decision, with renewed US-Iran fighting, a hawkish Fed tone, and another CLARITY Act delay all working against a sustained move above nearby resistance.
What Happened This Week
The Federal Reserve held its benchmark rate at 3.50%-3.75% on July 29, a decision confirmed by a 9-3 vote, with three policymakers favoring a quarter-point hike instead.
Fed Chair Kevin Warsh rejected the idea of a “soft target” for inflation, reaffirming the central bank’s commitment to its 2% objective, a tone that reduced expectations of easier financial conditions ahead and offered little relief.
Separately, fighting between the US and Iran escalated, with US forces striking Islamic Revolutionary Guard Corps targets after Iran fired missiles toward a US base in Jordan, missiles Jordanian air defenses intercepted.
Crude oil held above $84 after surging 6.6% in the prior session, raising concerns about Persian Gulf energy supplies and Red Sea shipping, a combination that keeps inflation expectations and Treasury yields elevated and reduces the appeal of speculative assets broadly.
US stocks fell sharply the same day, with the Dow down 2.2%, the S&P 500 down 1.5%, and the Nasdaq down 1.7%, while Bitcoin recovered most of its post-Fed decline rather than extending losses, a sign of relative resistance to the wider risk-off move even if it hasn’t translated into a breakout.
The Senate also postponed action on the Digital Asset Market Clarity Act, shifting attention toward a Russia sanctions package and federal nominations, narrowing the runway to advance the bill before the August 8 recess.
Senate Republicans released updated text combining Banking and Agriculture Committee proposals on July 22, but unresolved ethics language and the need for Democratic support remain obstacles.
The delay didn’t cause Bitcoin’s pullback on its own, but it removed a potential catalyst that could have bolstered institutional confidence at a time when other risks were already mounting. Readers can find more background on this bill in our coverage of the CLARITY Act.
For institutional data, US spot Bitcoin ETFs recorded about $32.1 million in net inflows on July 29, with BlackRock’s IBIT alone pulling in $89.8 million, according to Farside Investors, implying other funds saw offsetting outflows even as the category overall stayed positive.
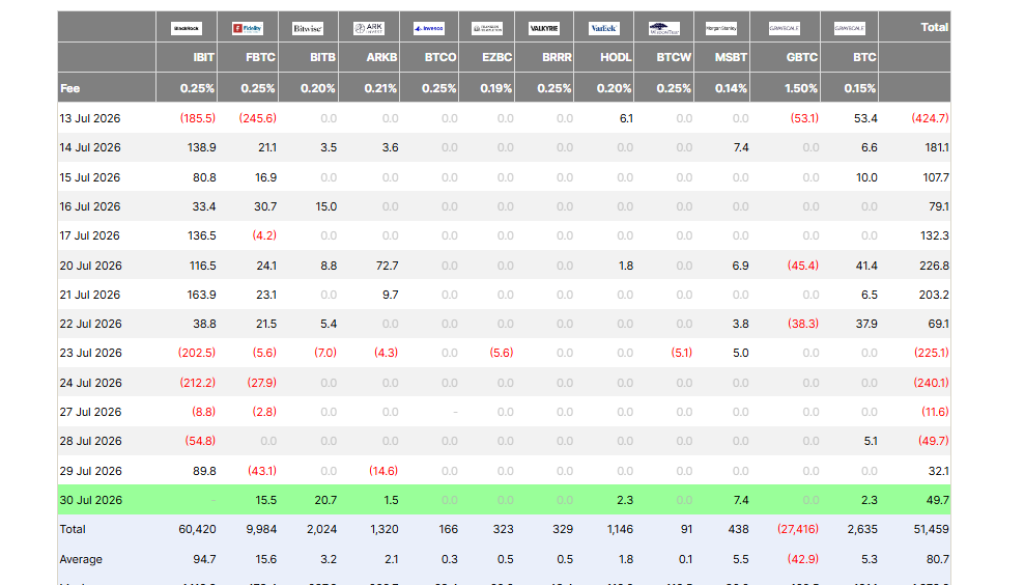
That’s a modest total, but it shows institutional demand persisted through the sell-off rather than shifting entirely into traditional havens.
What the Indicators Show for Bitcoin
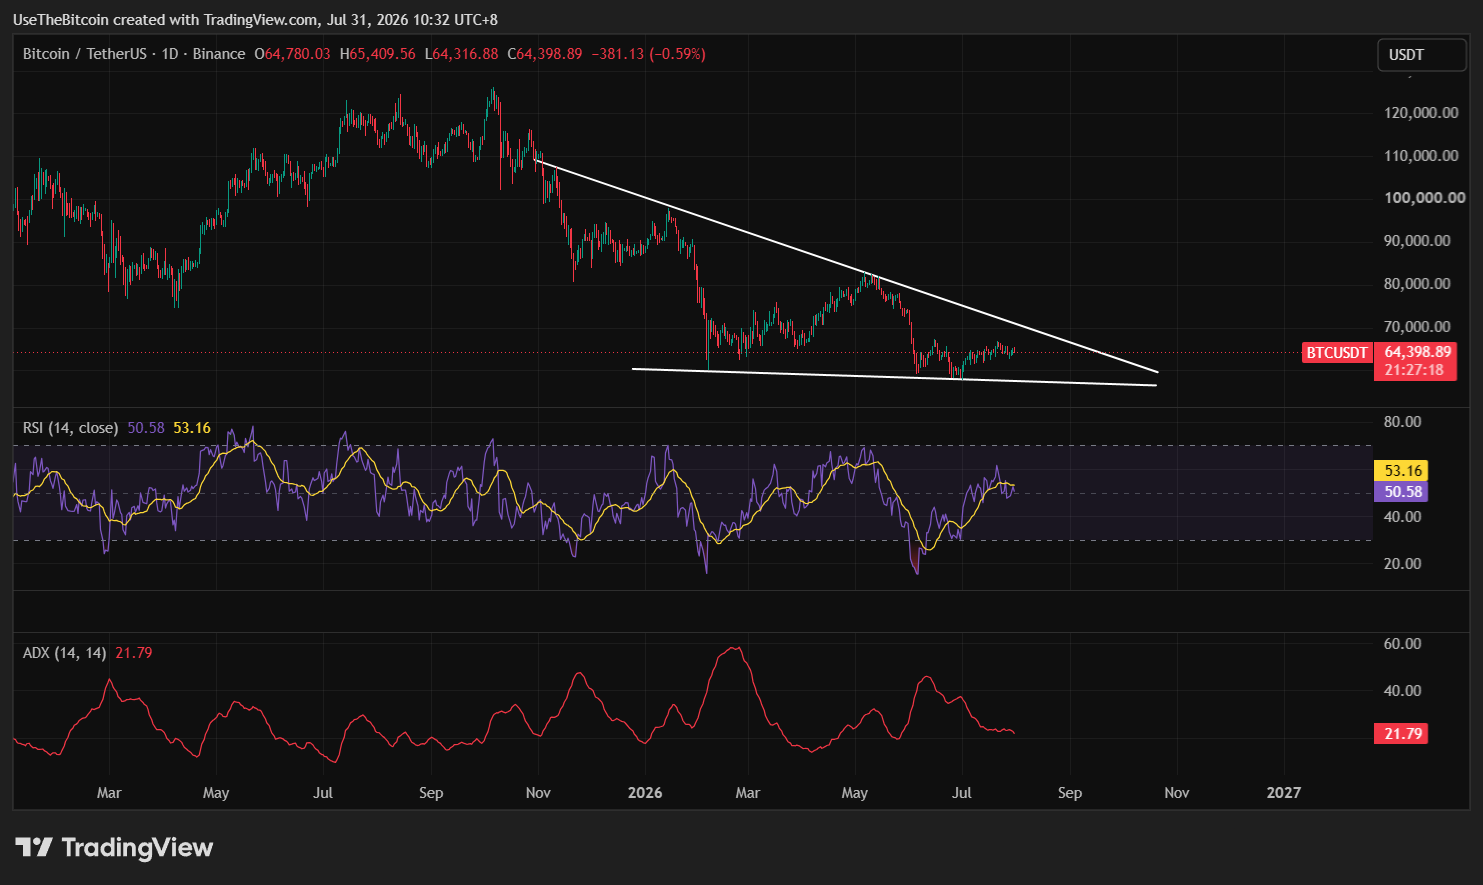
Momentum for Bitcoin remains mixed rather than leaning firmly one direction. On the daily timeframe, RSI sits above 50, which is squarely neutral, while the daily Average Directional Index (ADX) is at 21.79 points for weak trend strength, reinforcing that Bitcoin is consolidating rather than trending.
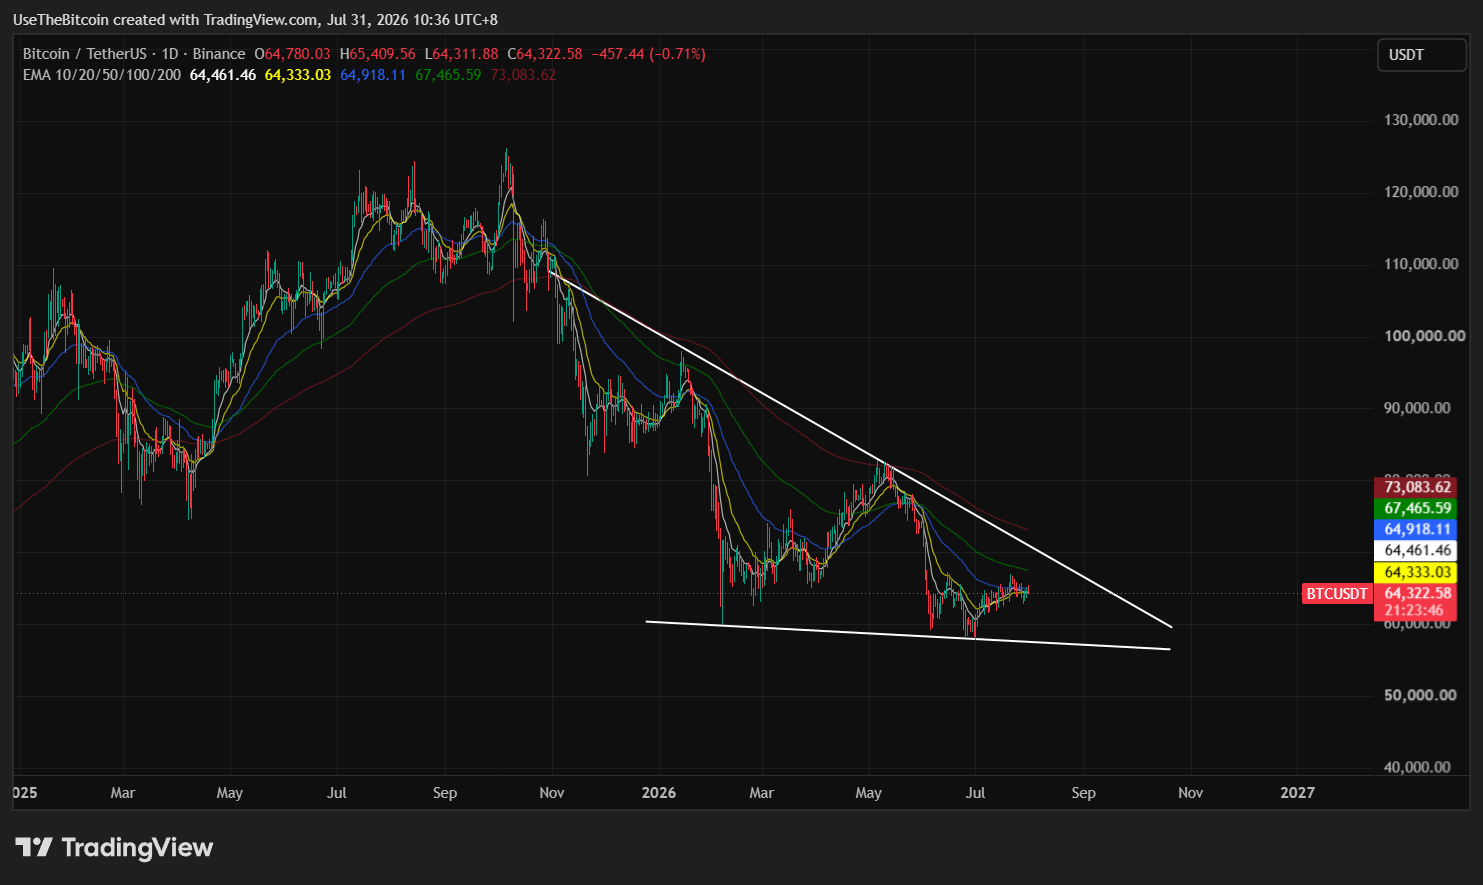
Shorter-term moving averages, the 10- and 20-period EMAs and several SMAs, cluster close to the current price with Buy signals, while longer-term averages tell a different story: the 50-period EMA near $64,879, the 100-period EMA near $67,475, and the 200-period EMA near $73,130 all sit in Sell territory, meaning Bitcoin would need a sustained move to clear a stack of resistance that gets progressively higher.
On-Chain and Sentiment Signals for Bitcoin
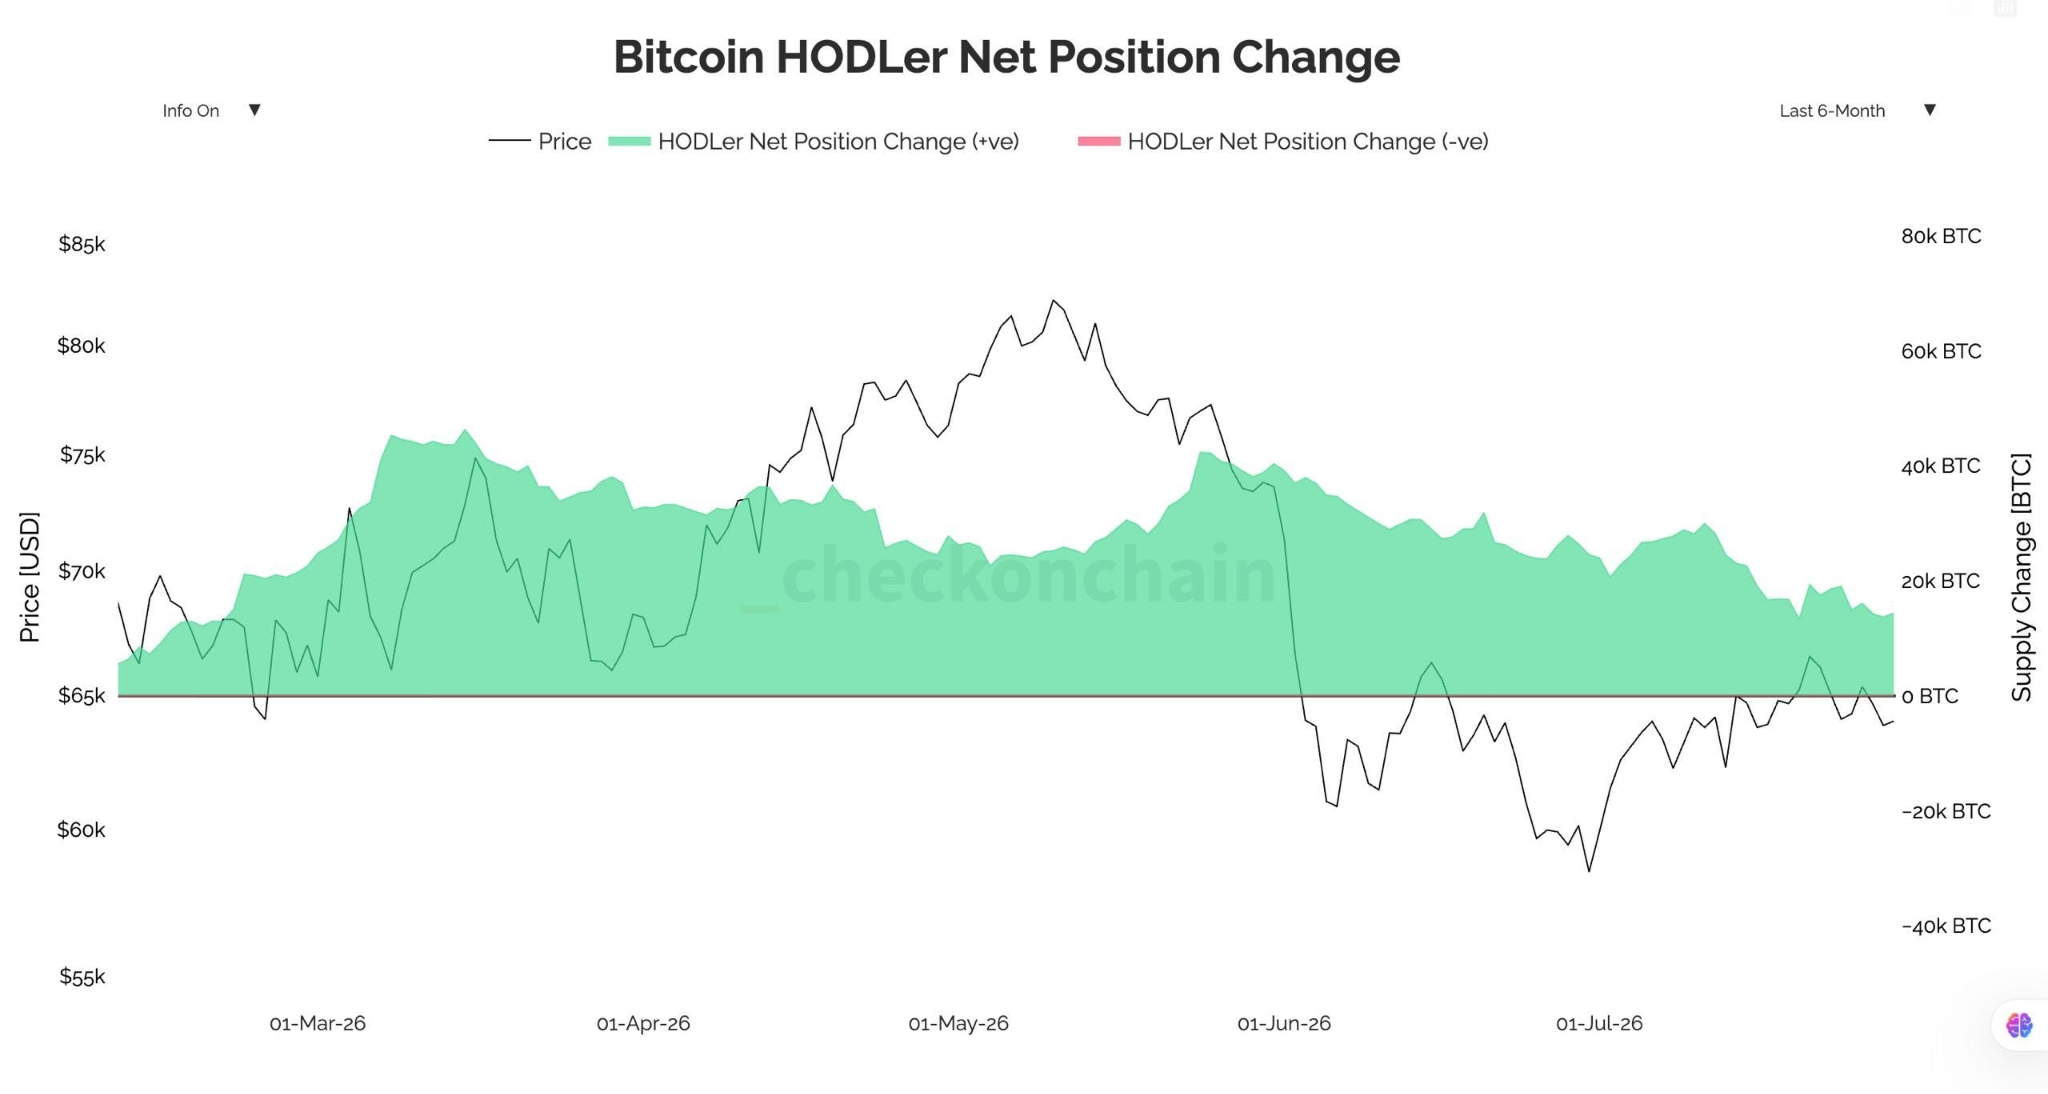
Large holders added roughly 29,075 BTC during the recent pullback, according to Ali Charts, bringing total whale holdings to an estimated 13.64 million BTC, though accumulation alone doesn’t confirm timing for any breakout.
That pattern has precedent as long-term holders reportedly added more than 270,000 BTC over a two-week stretch earlier this year even as US spot ETFs saw substantial outflows in June, a reminder that different investor cohorts aren’t always moving in the same direction at the same time.
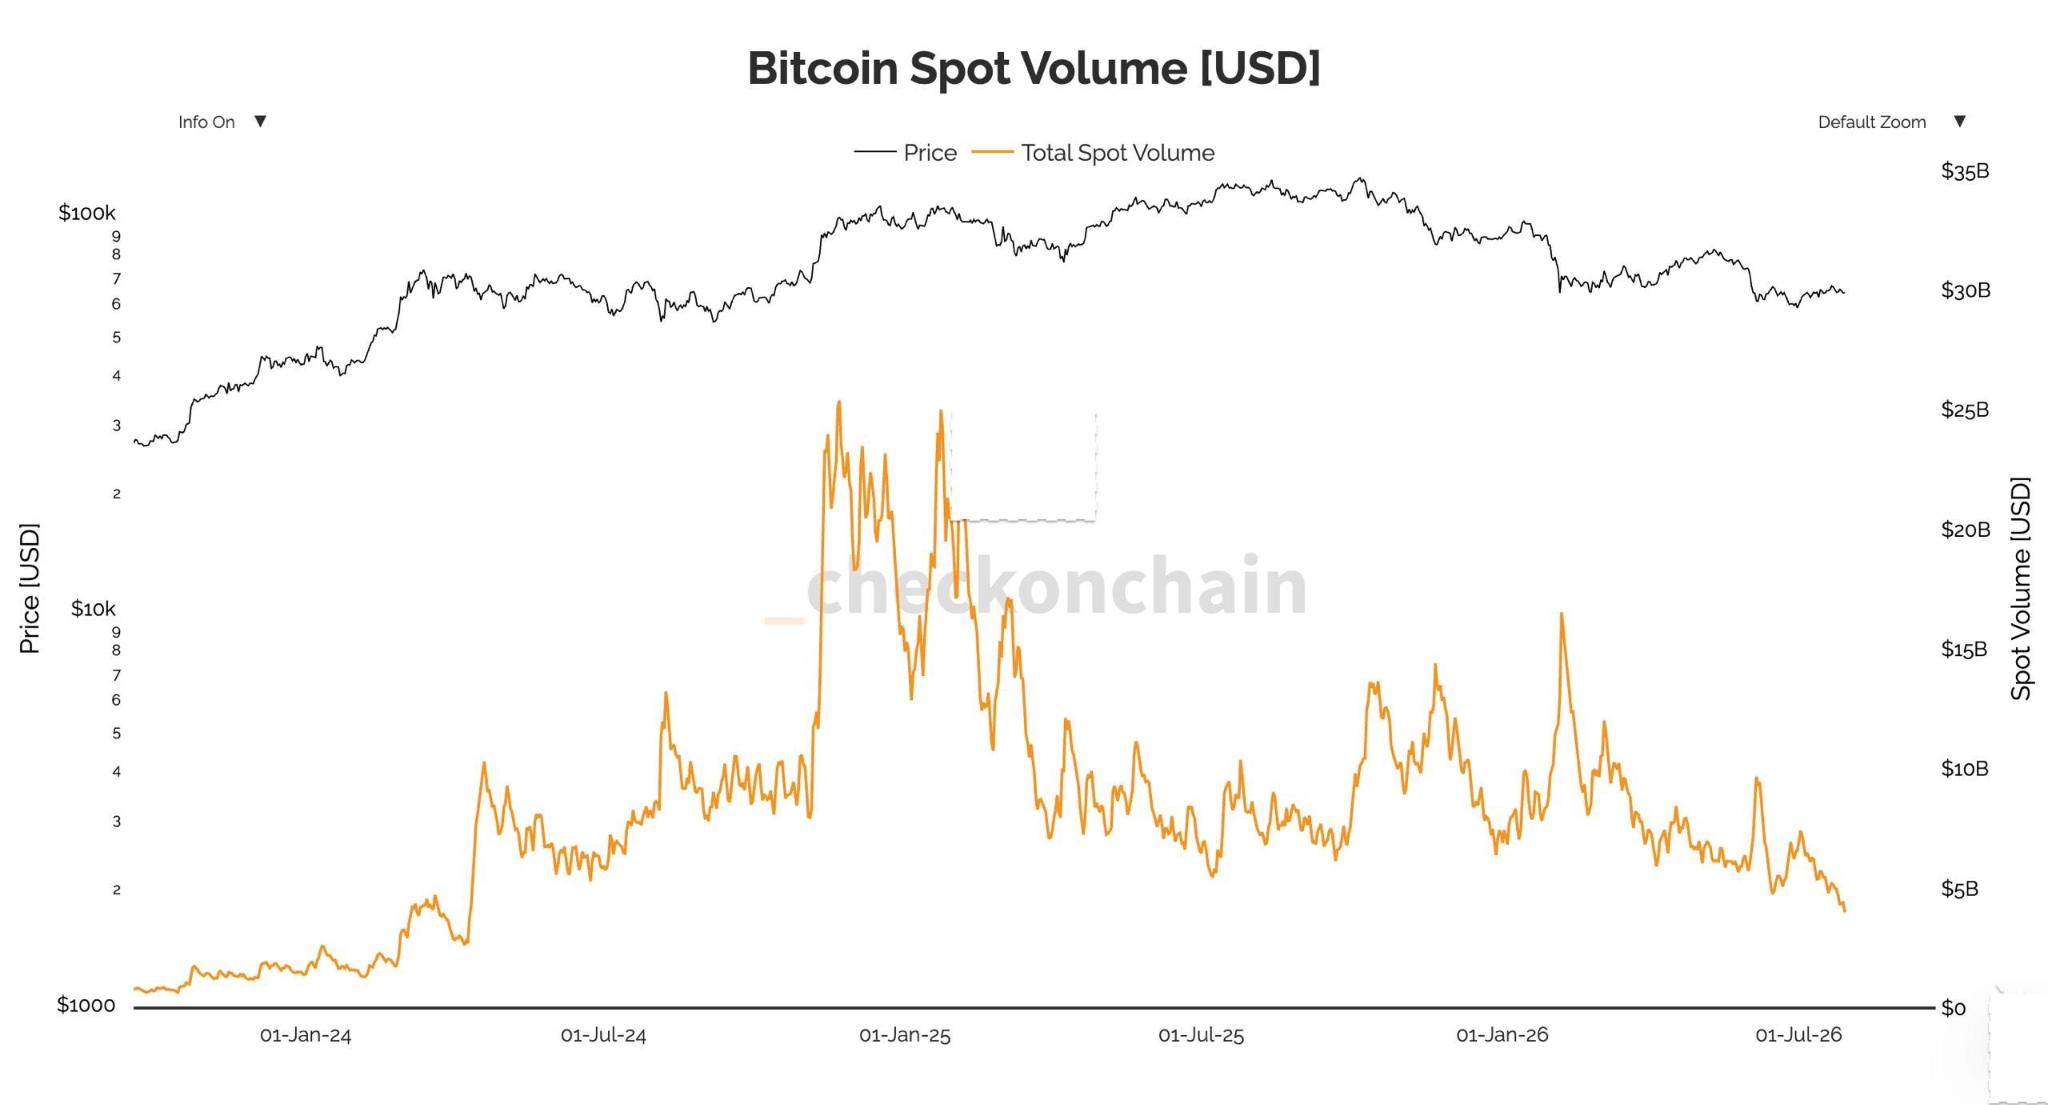
Separately, Bitcoin spot trading volume has fallen to around $4.5 billion a day, the weakest level since 2024 and well down from roughly $25 billion a day at the peak of the 2025 bull market, according to Checkonchain data.
Long-term holder net additions have also slowed, from about 40,000 BTC in late May to roughly 14,000 BTC in late July, suggesting accumulation continues but at a reduced pace.
The Fear and Greed Index stood at 28, down from 29 and still inside “fear” territory, while separate reporting on Google search interest shows public attention to Bitcoin fading even as price sits near widely watched support, a pattern one analyst described as fear-driven rather than boredom-driven, based on the idea that broader public interest historically returns only after price has already moved higher.
What Analysts Are Saying for Bitcoin
Crypto_Scient, who opened a Bitcoin position on July 28, has flagged the roughly $64,000 mid-range zone as important support while eyeing a potential move toward $68,000-$69,000 if price reaches the upper end of its current range.
Ali Charts has offered the more bullish technical read, noting an inverse head-and-shoulders pattern with a neckline near $66,500.
The analyst argues that a decline toward $60,000 could complete a constructive right shoulder rather than invalidate the setup, with a confirmed break above the neckline placing $74,000 in play.
Trader Lennaert Snyder said Bitcoin was attempting to hold $64,000 after the Fed meeting but remained vulnerable given the liquidity generated below Tuesday’s $62,800 low, flagging $64,800 and $65,800 as levels where fresh short positions could reappear.
| Level | Role | Notes |
| $60,000 | Psychological/structural downside target | Possible inverse head-and-shoulders right-shoulder completion zone |
| $62,000–$62,676 | Near-term support | 4-hour liquidation cluster and daily lower Bollinger Band |
| $63,000–$63,300 | Downside liquidity cluster | Losing the 4-hour trendline could pull price here first |
| $63,515 | Classic daily pivot point | Derived from the prior session’s high, low, and close |
| $63,800 | Key support region | Identified separately by Ali Charts |
| $64,512 | Daily Bollinger Band midpoint | Price trading just above this as of July 30 |
| $64,600 | Rising 4-hour trendline | Current battleground level |
| $64,900–$65,200 | Upside liquidation cluster | A move here could trigger short liquidations |
| $65,000 | Watched support/resistance pivot | Also cited as a key level in social-sentiment coverage |
| $66,000–$66,500 | Inverse head-and-shoulders neckline | Confirmed break needed to validate the bullish pattern |
| $66,348 | Daily upper Bollinger Band | Immediate ceiling on the daily chart as of July 30 |
| $67,000 | Additional upside liquidity | Sits just above the $66,500 neckline zone |
| $68,995 | First major pivot resistance | Sits almost exactly at the widely watched $69,000 zone |
| $73,130 | 200-period EMA | Longer-term resistance |
| $74,000 | Inverse head-and-shoulders measured target | Only in play on a confirmed break above the neckline |
Bottom Line
Bitcoin needs to clear and hold above $66,500 and open a path toward $68,995 and eventually $74,000, while a breakdown of the $63,000-$63,800 zone would expose $62,000 and the psychological $60,000 level, an area some analysts view as a plausible constructive dip.
With a hawkish Fed, active Iran-related conflict, a delayed CLARITY Act, and fading public search interest all weighing on sentiment simultaneously, the setup remains two-sided, and the next confirmed break, in either direction, is likely to matter more than any single indicator on its own.
Disclosure: The writer holds Bitcoin.
Frequently Asked Questions
Need a refresher? Here are the questions traders are asking about Bitcoin this week.
Why is Bitcoin stuck between $63,000 and $66,500?
Bitcoin has repeatedly failed to hold gains above roughly $65,000 while also finding buyers whenever it approaches the low $63,000s, creating a range that’s held for several sessions. A hawkish Fed, renewed Iran-related conflict, and a delayed CLARITY Act have combined to remove near-term catalysts that could push price decisively out of that band in either direction.
What are the liquidation clusters around Bitcoin’s current price?
Concentrated leverage sits near $64,900 to $65,200 on the upside, where a move higher could trigger short liquidations and briefly accelerate any rally. On the downside, clusters near $63,000 to $63,300 and further out near the $62,000 mark are areas where losing the current trendline could pull price toward before any deeper move.
Did the Fed’s rate decision help or hurt Bitcoin?
The Fed left rates unchanged, but the 9-3 vote and Chair Kevin Warsh’s rejection of a “soft” inflation target signaled continued caution rather than an imminent shift toward easier policy, limiting the relief that steady rates might otherwise have provided.
Are Bitcoin whales still buying during this pullback?
Large holders added roughly 29,075 BTC during the recent decline, according to on-chain data, though the pace of long-term holder accumulation has slowed compared to earlier in the year. Whale buying during a pullback doesn’t confirm the timing of any recovery, but it does suggest that larger holders aren’t treating current prices as a reason to exit.
Does falling Google search interest in Bitcoin matter?
The current drop in search interest is seen as fear-driven rather than a sign of disinterest, given that broader public attention has historically returned only after Bitcoin has already moved higher in past cycles. It’s a sentiment indicator rather than a technical one, and doesn’t independently confirm where the price goes next.