
Ethereum is trading near $2,500 as buyers try to hold the latest recovery ahead of the inflation report later this week.
ETH has reclaimed the $2,500 area but continues to face resistance between roughly $2,511 and $2,546. Exchange outflows and whale accumulation are providing support, while retail selling and slower ETF inflows are limiting momentum.
The next major macro catalyst is the August Consumer Price Index (CPI) report on September 11, which could reshape expectations for the Federal Reserve’s September Federal Open Market Committee (FOMC) meeting and help determine whether Ethereum can extend its move above $2,500 or return toward support.
Ethereum Faces Resistance Above $2,500
Ethereum has made several attempts to move above $2,500, but buyers have not yet secured a sustained breakout.
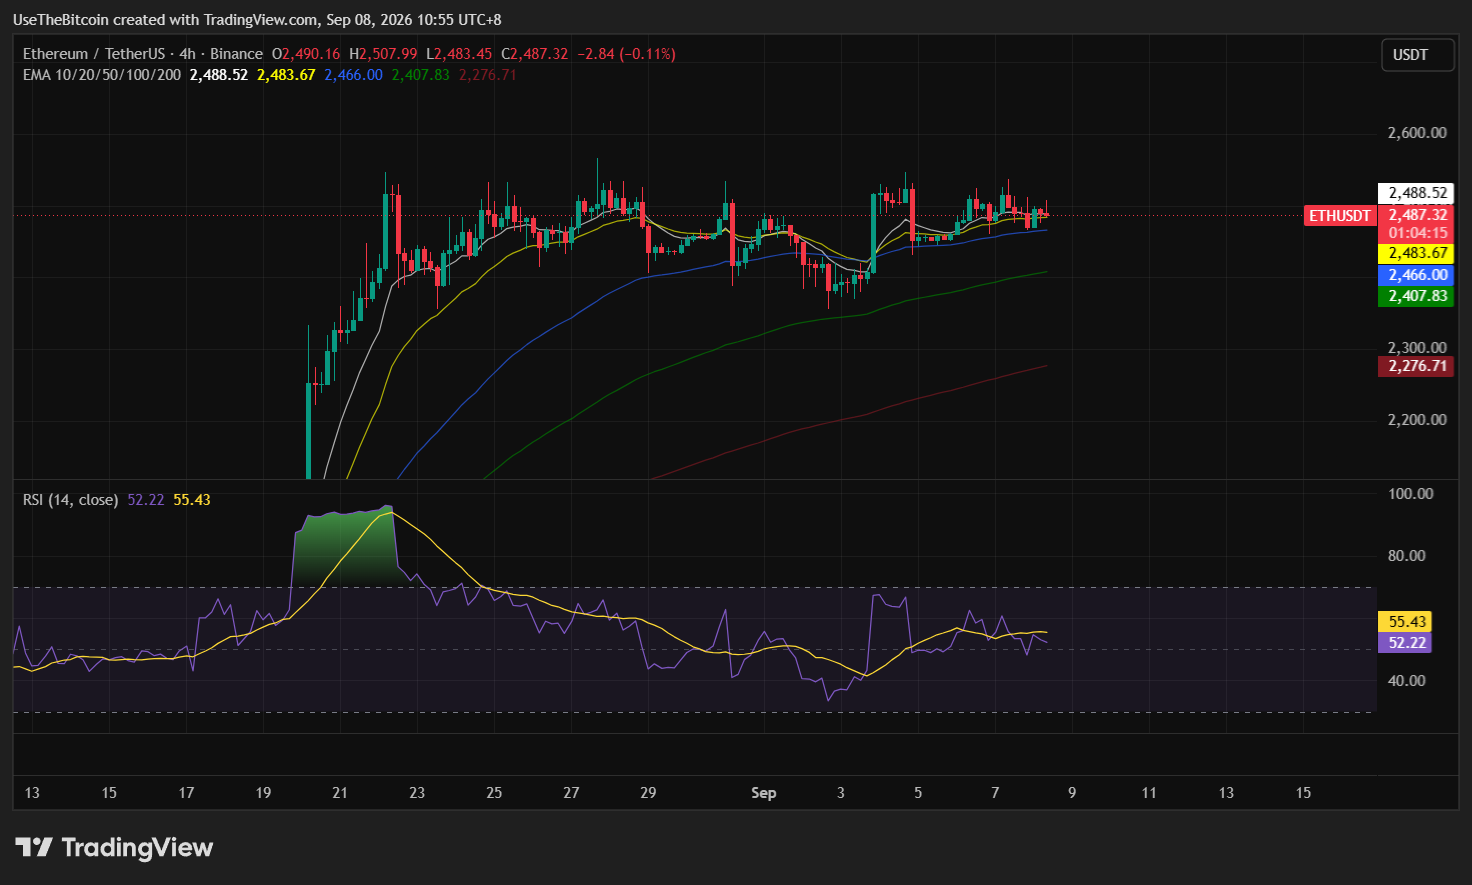
Immediate resistance sits between roughly $2,511 and $2,546. A daily close above that zone would improve the short-term structure and bring $2,626 into focus, followed by the $2,690 to $2,750 area.
The larger supply zone extends from roughly $2,723 to $2,822, where a significant amount of ETH previously changed hands.
| Level | Role |
| $2,385–$2,431 | Near-term support |
| ~$2,475 | Key on-chain support |
| $2,511-$2,546 | Immediate resistance |
| $2,626 | Next resistance |
| $2,690–$2,750 | Bullish target area |
| $2,723–$2,822 | Major supply zone |
Table 1. Ethereum Key Support and Resistance Levels
As long as Ethereum remains above the $2,431 to $2,475 area, buyers still have room to try again at resistance.
$300M in ETH Leaves Exchanges
Exchange balances are providing one of the stronger signals behind Ethereum’s current setup.
About 116,000 ETH worth more than $300 million was withdrawn from exchanges between September 6 and September 7, according to chart analyst Ali Martinez on X.
Exchange balances subsequently fell to around 11.92 million ETH, their lowest level since August 31.
Lower exchange balances can reduce the amount of ETH immediately available for sale, although withdrawals alone do not prove that holders intend to keep the assets long term.
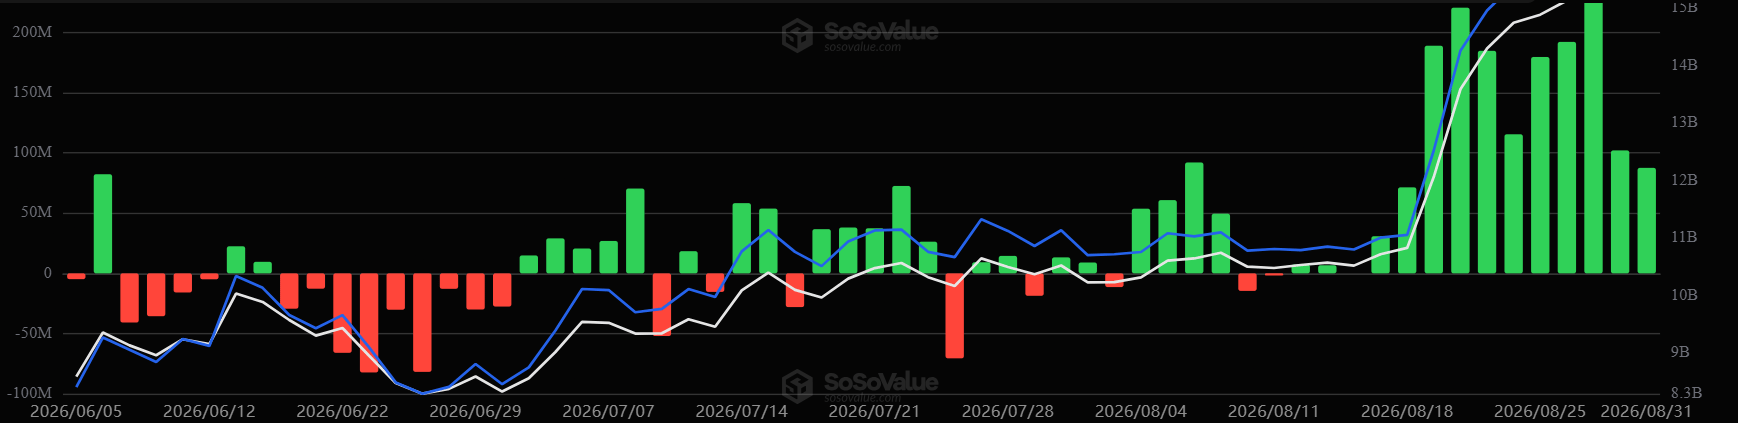
The decline in available exchange supply follows strong institutional demand in August, when US spot Ethereum ETFs recorded around $1.85 billion in net inflows, according to SoSoValue data.
Retail Selling Is Offsetting Whale Buying
Holder data shows a more mixed picture as wallets holding between 1,000 and 10,000 ETH reduced their balances by around 214,000 ETH last week, while wallets holding 100 to 1,000 ETH sold another 93,000 ETH, according to CryptoQuant.
If combined, those two groups distributed roughly 307,000 ETH.
Whale wallets holding between 10,000 and 100,000 ETH added around 82,000 ETH over the same period.
| Wallet Activity | ETH Change |
| 1,000–10,000 ETH wallets | -214,000 ETH |
| 100–1,000 ETH wallets | -93,000 ETH |
| Combined distribution | -307,000 ETH |
| 10,000–100,000 ETH whales | +82,000 ETH |
| Distribution vs. whale accumulation | ~3.7x |
Table 2. Ethereum Holder Activity Over the Latest Week
The reported distribution from smaller wallet groups was around 3.7 times larger than whale accumulation during the period, providing context for why ETH has struggled to extend its breakout despite lower exchange balances.
Ethereum ETF Demand Has Slowed
ETF flows remain positive but have cooled sharply from the previous week.
US spot Ethereum ETFs attracted around $218.41 million last week, compared with approximately $824.42 million the week before, representing a decline of roughly 73.5%.
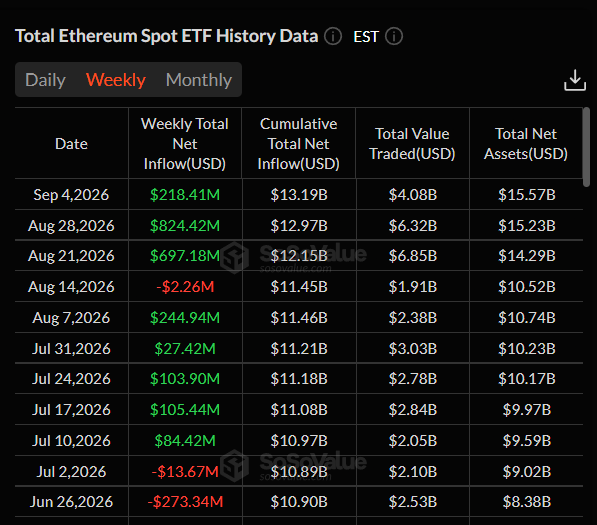
Bitcoin ETFs attracted about $986.9 million over a similar period, meaning Ethereum received substantially less institutional capital last week.
Notably, the slowdown does not erase Ethereum’s strong August ETF performance, but it removes some of the buying pressure that helped ETH recover earlier in the month.
CPI Is the Next Major Test for Ethereum
The August US CPI report is scheduled for September 11, making it the most immediate macro event for Ethereum traders.
The previous CPI report showed headline inflation running at 3.4% year over year in July, while the core CPI (which excludes selected food and energy items) increased 2.5% over the same period.
A hotter-than-expected August reading could strengthen expectations that the Federal Reserve will keep monetary policy tighter, potentially pushing Treasury yields and the dollar higher, generally creating a more difficult environment for Ethereum and other risk assets.
On the other hand, a softer inflation reading could have the opposite effect by easing pressure on yields and improving expectations for less restrictive monetary policy.
For ETH, the reaction around $2,500 could therefore depend heavily on whether CPI changes the market’s view of the September FOMC decision.
CPI Could Shape the September FOMC Outlook
The Federal Reserve remains the larger macro event, but CPI comes first. The inflation report will be one of the important data points investors use to reassess the outlook before the September FOMC meeting.
| CPI Scenario | Possible Market Reaction | Possible Impact on Ethereum |
| Softer inflation | Rate-hike expectations ease | Supports a move above $2,544 |
| Inflation near expectations | Fed outlook changes little | ETH may remain near $2,400–$2,550 |
| Hotter inflation | More hawkish Fed expectations | Raises risk of a move toward support |
Table 3. How CPI Could Affect Ethereum Ahead of the FOMC
The scenarios above are not forecasts. Ethereum’s actual reaction will also depend on Treasury yields, the dollar, ETF flows, and broader crypto market sentiment.
Momentum Remains Constructive
Ethereum continues to trade above its major daily exponential moving averages.
The 20-day EMA sits near $2,394, while the broader group of major moving averages extends from roughly $2,102 to $2,465.
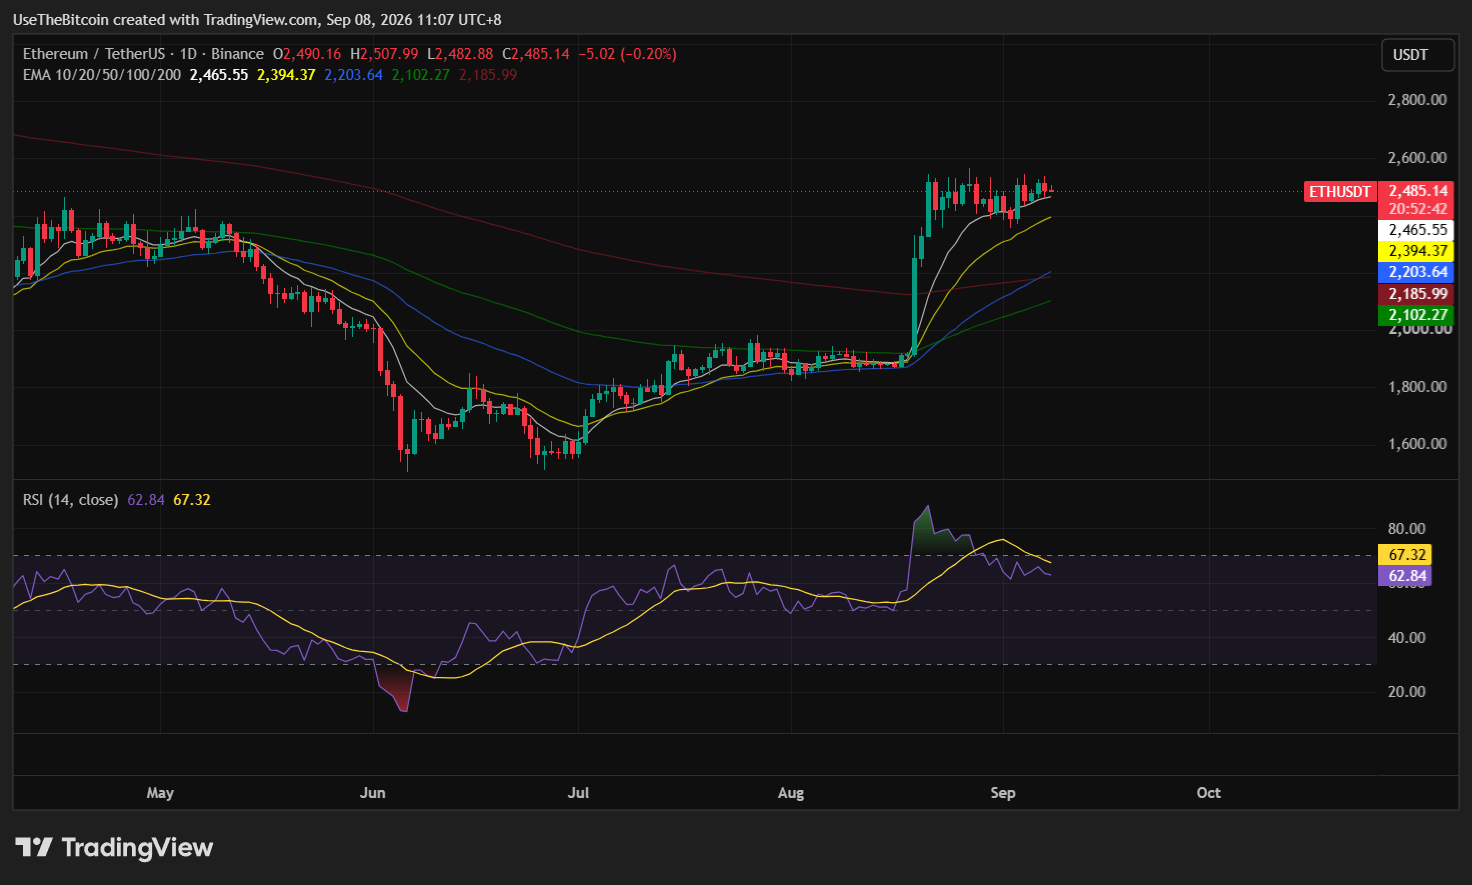
Holding above those levels keeps the medium-term recovery intact.
The daily RSI is around 62.87, suggesting momentum remains positive without reaching an extreme overbought level. However, the RSI is weakening while ETH’s price has stayed flat for the past few days.
If ETH falls below $2,475, the $2,431 to $2,385 zone becomes the next area to watch. A deeper break could put lower support near $2,190 back in focus.
| Scenario | Price Trigger | Possible Outcome on Ethereum |
| Bullish Case | Softer CPI helps ETH clear $2,546 and $2,626 | Momentum strengthens toward $2,690–$2,750 |
| Base Case | CPI is close to expectations and ETH holds $2,431–$2,475 | Consolidation continues around $2,500 |
| Bearish Case | Hotter CPI pressures risk assets and ETH loses $2,431–$2,385 | Recovery weakens and lower support comes back into focus |
Table 4. Ethereum Bullish, Base and Bearish Scenarios. These scenarios can change as inflation data, ETF flows, and Fed expectations develop.
Bottom Line
Ethereum is holding near $2,500, but the August CPI report is now the most important short-term catalyst.
A softer inflation reading could help buyers challenge the $2,515 to $2,544 resistance zone and potentially open a move toward $2,626. A hotter CPI print could increase pressure on ETH and shift attention back toward $2,475 and the $2,431 to $2,385 support area.
This article is for informational purposes only and does not constitute financial advice. Crypto price predictions are based on analyst estimates and are not guarantees of future performance. Do your own research before making any investment decisions.
Frequently Asked Questions
Need a refresher? Here are some common questions traders are asking about Ethereum’s current setup.
Why Is CPI Important for Ethereum?
CPI measures changes in consumer prices and can influence expectations for Federal Reserve policy. Higher-than-expected inflation can increase expectations for tighter monetary policy, while softer inflation can reduce that pressure.
When Is the Next US CPI Report?
The August 2026 CPI report is scheduled for September 11 at 8:30 A.M. Eastern Time.
How Could CPI Affect the September Fed Decision?
A hotter inflation report could strengthen the case for tighter policy, while weaker inflation could reduce pressure on the Fed to remain aggressive. CPI is therefore one of the important data points markets will use when pricing the September FOMC decision.
Why Is Ethereum Struggling Around $2,500?
The $2,500 to $2,546 area remains a short-term resistance zone. Retail selling and slower ETF inflows are also limiting demand while buyers attempt to push ETH higher.
Are Ethereum Exchange Outflows Bullish?
They can be supportive because lower exchange balances may reduce immediately available supply for selling. However, withdrawals do not guarantee that ETH will rise.