Key Takeaways
- A price chart shows how an asset’s price changes over time.
- Being able to read charts is a huge advantage in the crypto space even if you do not plan to go into full-time trading.
- You do not need to be an expert at reading charts, you only need enough knowledge to identify if the price of a crypto asset is trending up, trending down, or even trading sideways.
Crypto charts can look overwhelming until someone explains them properly. I’m going to break down the basics of reading price charts and candlesticks in a simple, beginner-friendly way, so you can finally understand what’s happening on your screen.
Whether you are new to trading or just want to stop guessing what those candles mean, this will give you the foundation you need to read crypto charts.
Chart basics
If this is your first time looking at a chart and already intimidated just by looking at it, don’t worry because I was once like you before.
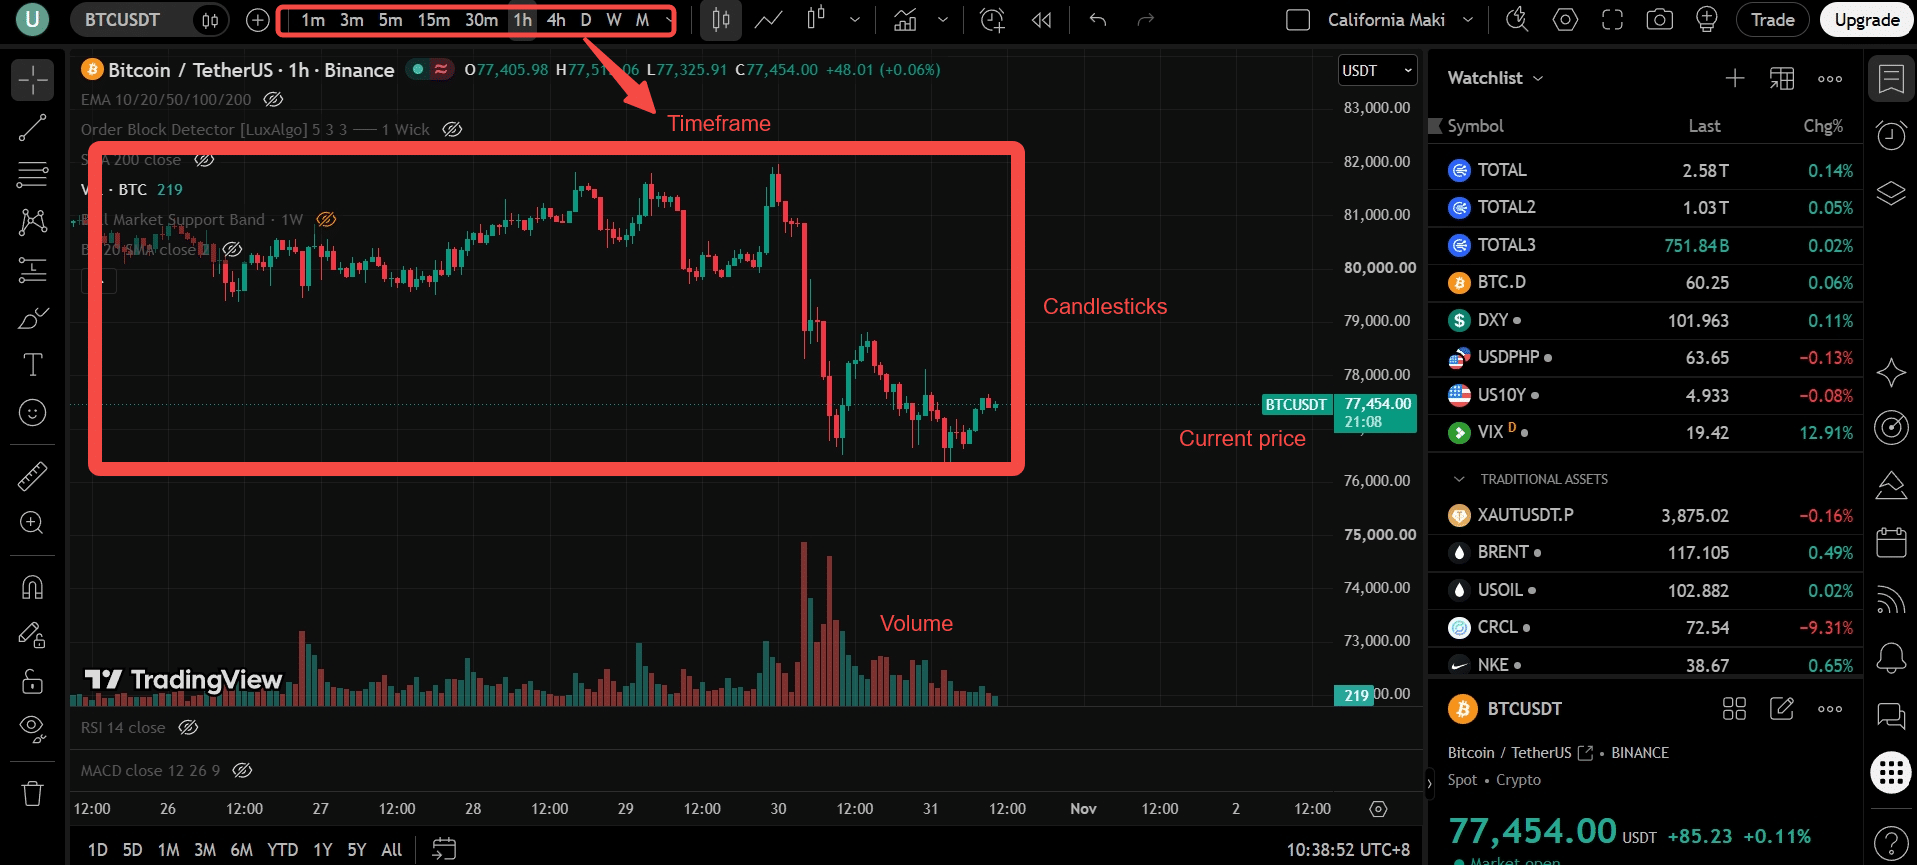
When you are starting out, the first thing you need to do is identify what you are looking at in the interface. The most important part of a chart is the timeframe, which can be in the minute timeframe, hourly timeframe, daily timeframe, weekly timeframe, and even monthly timeframe.
Next, the main body of the chart is the candlesticks, which tell you the past and present movement of the crypto asset in a given timeframe.
Then paired with the candlesticks is the price of the asset, which is currently trading at.
And lastly on the right side of TradingView is your watchlist, which you can fully customize with the assets you are specifically looking into.
Candlesticks explained
Of all the parts I mentioned above, we will focus more on candlesticks because they tell a “story” of how buyers and sellers fought to get to that price.
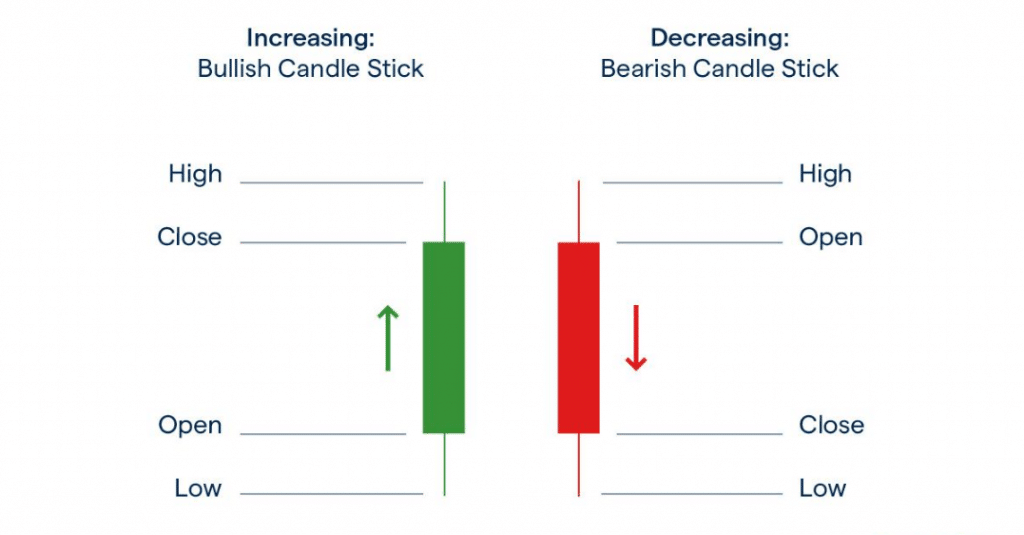
When looking at candlesticks, there are only two colors you need to remember, which are green and red.
Green candlesticks are bullish because the price appreciated and went upwards for the time period. On the other hand, red candlesticks are bearish because the price depreciated and went down in a given time period.
If you can see the figure above, the middle part of the green and red candlesticks is called the body. Meanwhile, the lines that stick out above and below the candlestick body are known as wicks.
For green candlesticks, the opening price is at the bottom of the body and the closing price is at the top. For red candlesticks, it is the opposite, the opening price is at the top, and the closing price is at the bottom.
The wicks at the top of the body show the highest price in the period, while the wicks at the bottom show the lowest price.
Common candle patterns
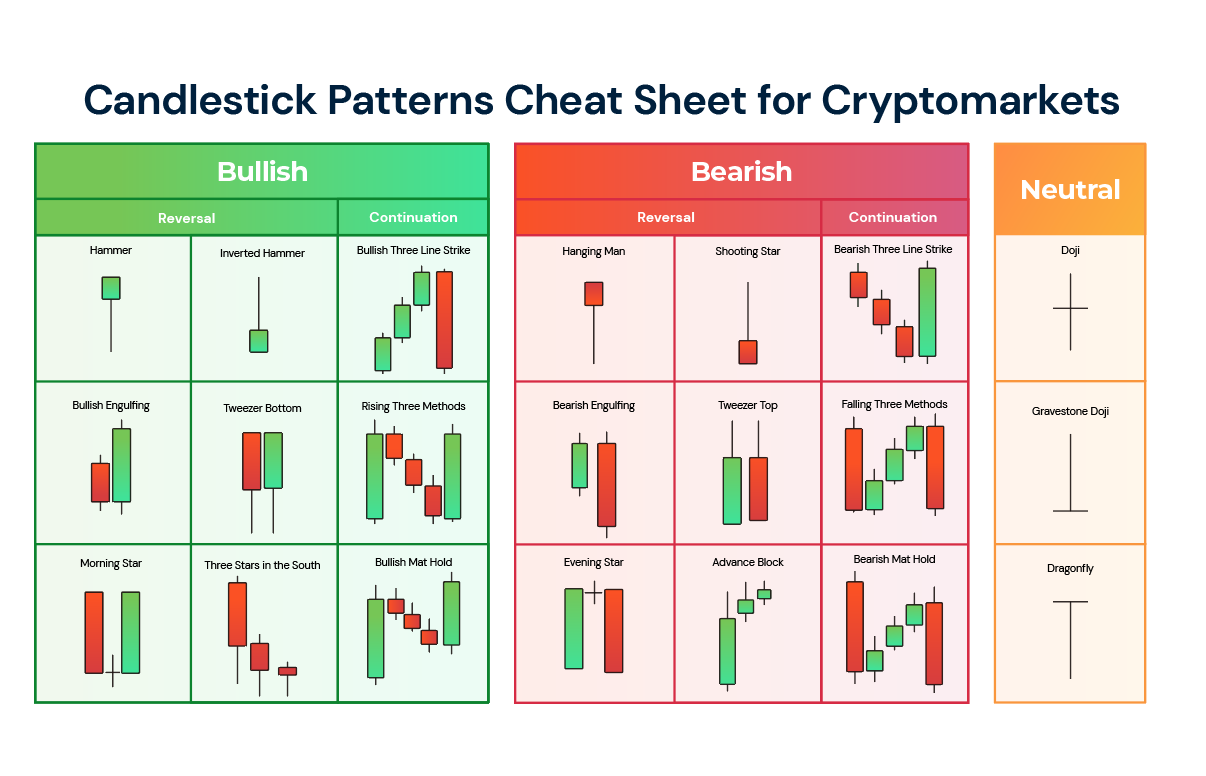
These are the most common candle patterns you can see when studying charts and candlesticks. When I started learning technical analysis, I stuck with candle patterns for over a year or two before moving on to other types of technical analysis. I know there are a lot of patterns but you will get the hang of them over time.
Trends, support and resistance
When reading charts, there are two concepts you need to learn and master as a beginner, which are trends and support and resistance.
Let’s discuss trends first. There are three types of trends, mainly uptrends, downtrends, and sideways trends.
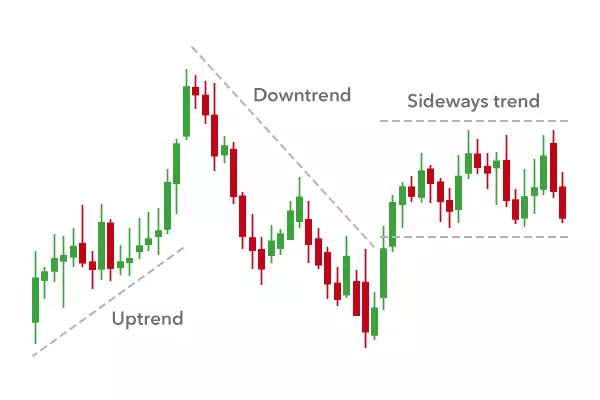
To say candlesticks are in an uptrend, they must have higher lows and higher highs. Meanwhile for downtrends, they must have lower lows and lower highs.
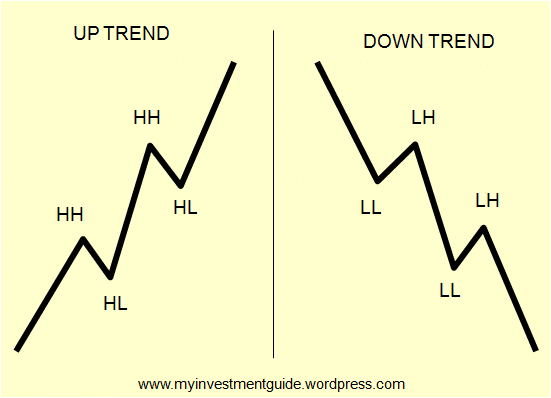
In trading, there’s a saying, “The trend is your friend until the end. Break that trend, you make a new friend.” That means your trading bias stays the same unless the trend finally breaks and you reverse your trading strategy as well.
Next in the discussion are support and resistance, the greatest example I can show to you is sideways markets.
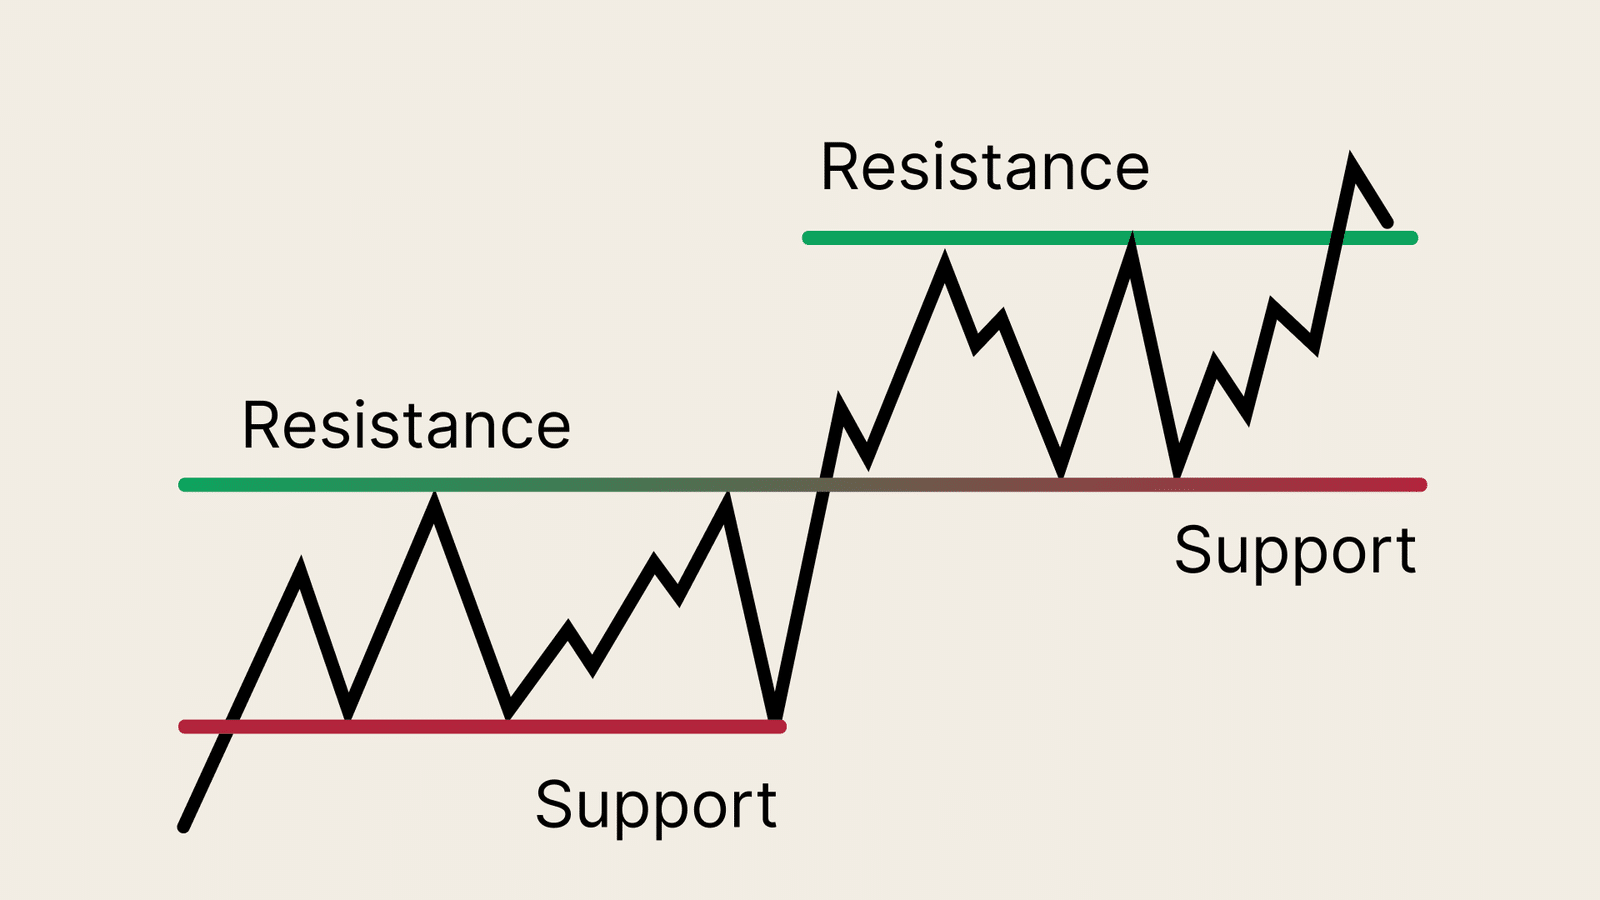
Support and resistance are price points where the market decides whether the asset is getting too expensive or too cheap.
Notably, they are key levels on price charts that have played an important role in the past and are also likely to hold up in the future.
That is why it is so important for traders to know about such levels because it can help them make better trading decisions around those levels and improve their trading quality.
Chart patterns
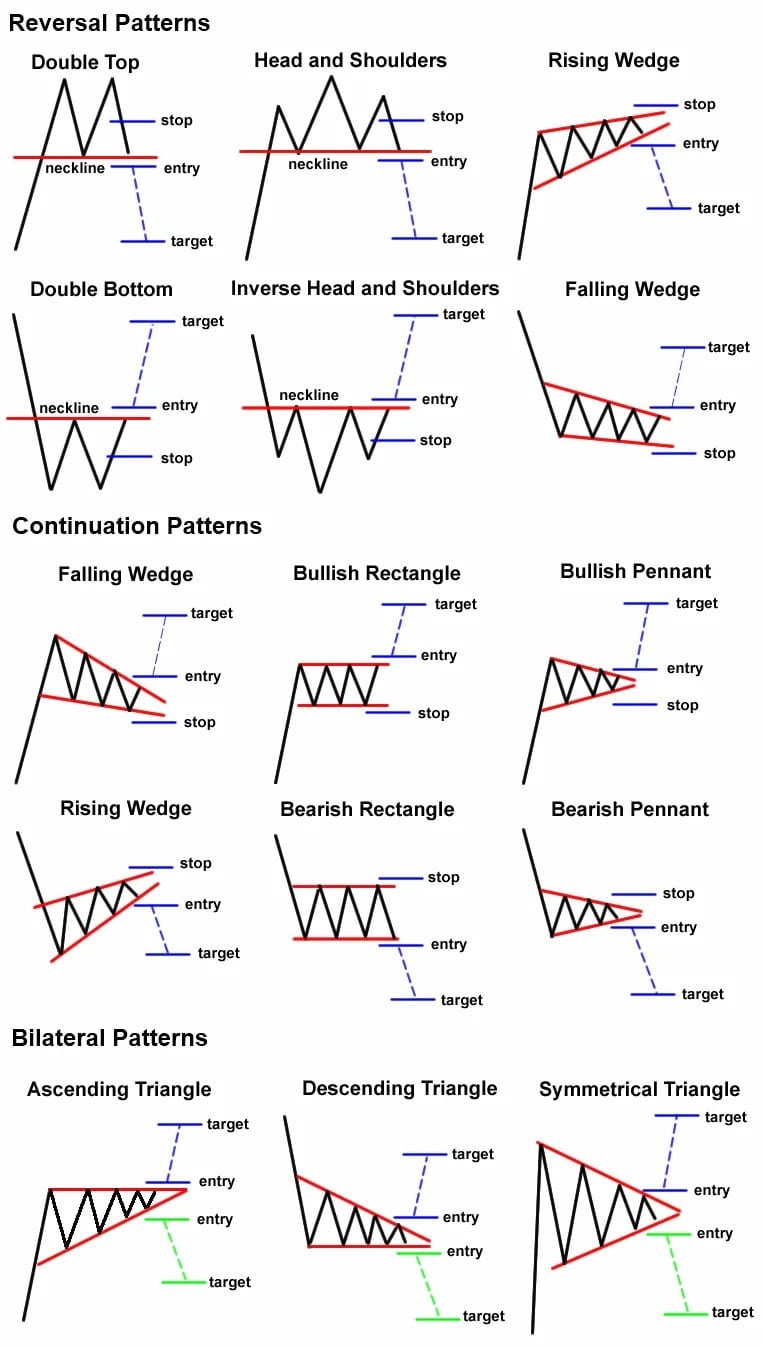
Chart patterns are different from candlestick patterns because candlesticks tell only part of the story, which I call “chapters.” Chart patterns are a larger part of the story, combining multiple candlestick “chapters.” Below are the most common chart patterns I expect you to memorize as well.
Key indicators
After learning about candlesticks and chart patterns, you need to pair them with indicators to add more confluence when analyzing the crypto market. Below are the most common indicators that I even use when charting.
Moving Averages
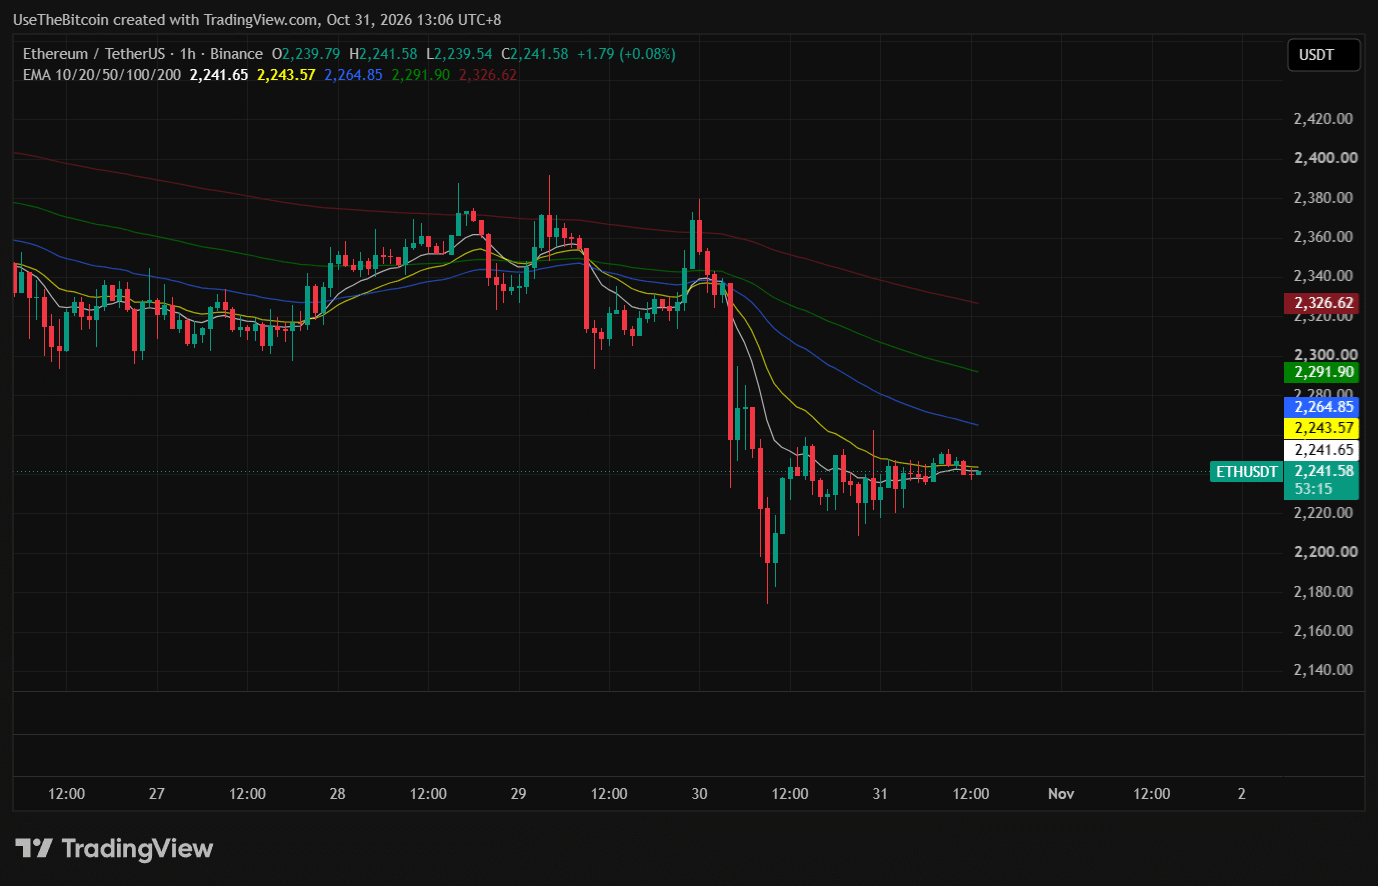
Moving averages are the average price of the last “N” number of periods. The letter “N” can be 5 days, 20 days, or even 200 days, depending on your requirement.
On the chart above, you can see I use a specific type of moving average called the Exponential Moving Average (EMA). A candlestick below the moving averages indicates bearish momentum, meaning the EMAs are acting as resistance.
Meanwhile, if the candlesticks are above the EMAs, it indicates bullish momentum as the EMAs act as support. In my chart, I currently have the 10, 20, 50, 100, and 200 EMAs, and what you can see is that the longer moving averages are located above the candlesticks meaning Ethereum is in bearish mode.
RSI
The Relative Strength Index (RSI) is an oscillating indicator that measures an asset’s momentum. Many traders and investors use this indicator to know whether the asset is overbought or oversold.
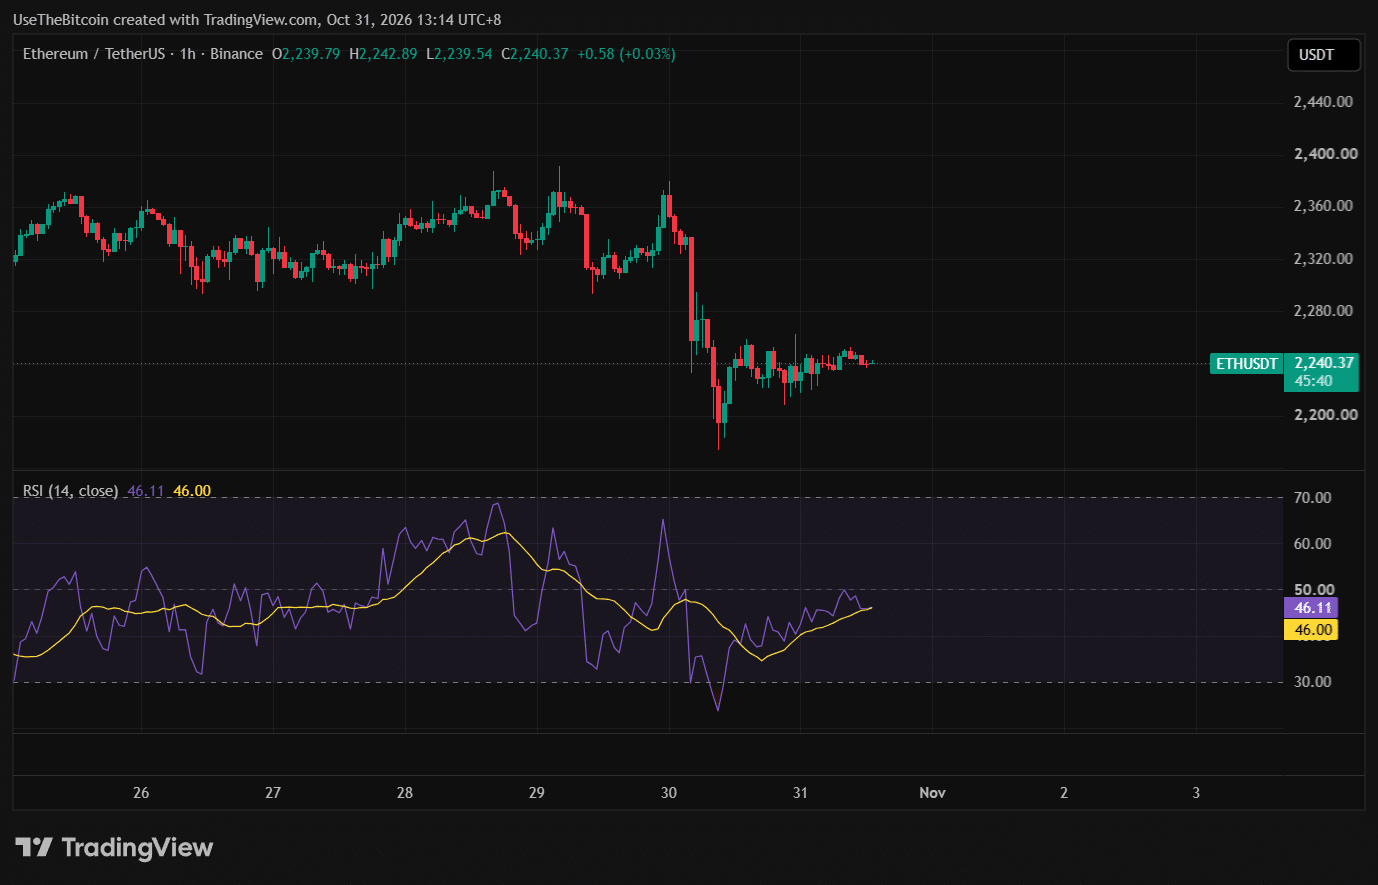
On the chart shown above, when the RSI reaches 30 or below 30, it means the asset is oversold. On the other hand, if the RSI goes to 70 or above 70, it means the asset is overbought.
The midline (the 50 on the middle) is an indicator of what the asset’s momentum is. If the RSI is below 50, that means the momentum is slowing down. If momentum is above 50, the asset is in bullish momentum.
As a beginner, learn this for now. As much as I would like to discuss more advanced topics on RSI like divergences, the introduction above is enough to keep you going before moving on to harder concepts.
MACD
MACD stands for Moving Average Convergence Divergence, and it uses moving averages to determine an asset’s momentum.
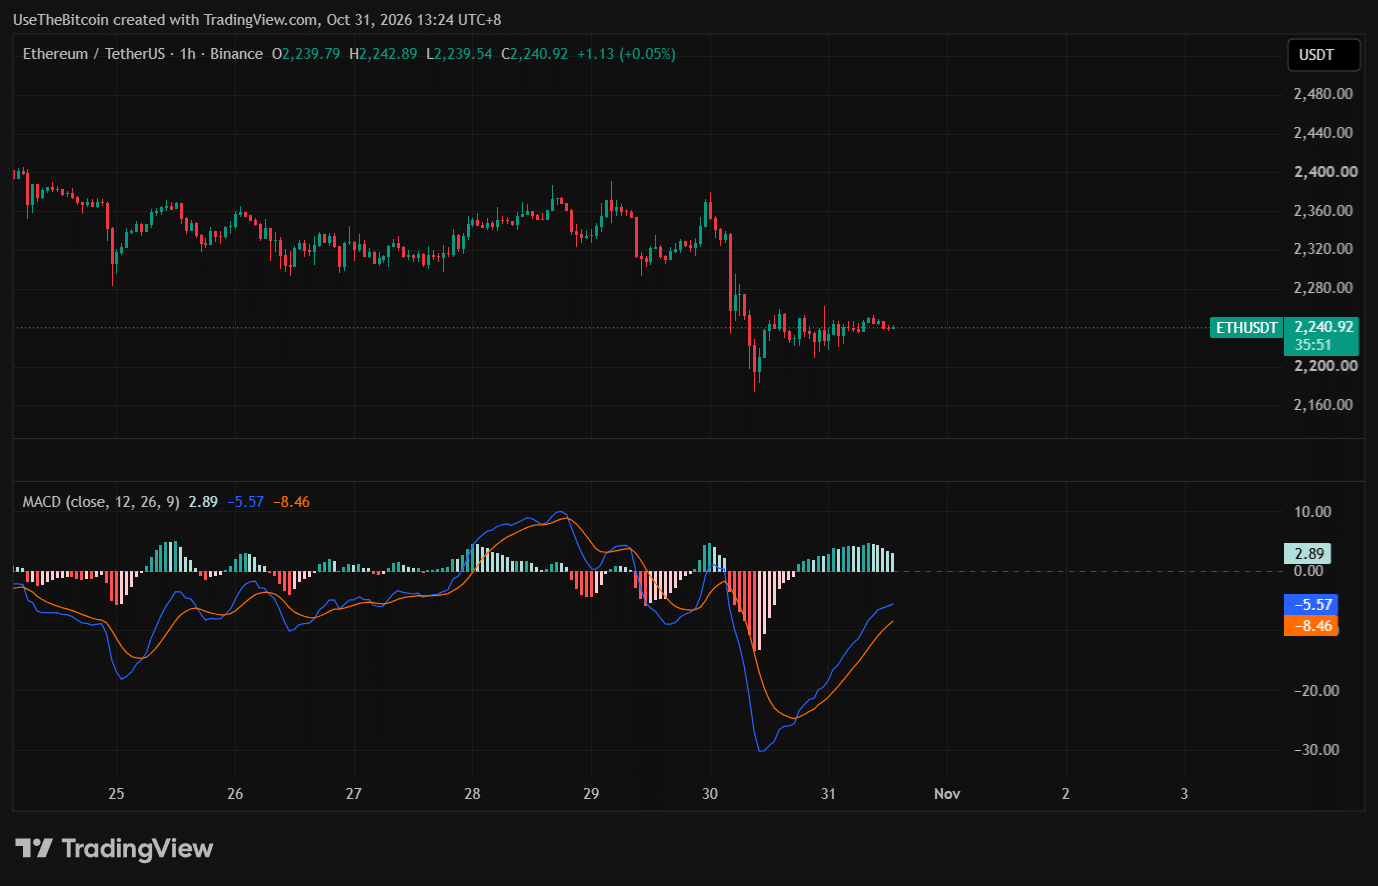
In the chart above, the MACD consists of the MACD line (blue), the signal line (orange), and the histogram.
The MACD line helps determine if the momentum is in a downward or upward trend.
The signal line is usually a 9-period EMA of the MACD line.
Lastly, the MACD histogram is a graphical representation calculated from the difference between the MACD line and the signal line. Instead of creating another line, the histogram is shown as a bar graph, making it easier to read and interpret.
For context, when the histogram is red, that means price is falling hard. When the red color changes to light red, that means the price may start to reverse to the upside. The same goes for green histograms.
Volume
Volume shows how many units of an asset changed hands and how active the market is during a specific timeframe.
Do note that volume means big compared to what’s around it. If you see a volume spike on the hourly chart, it’s only a tiny fraction compared to the daily chart.
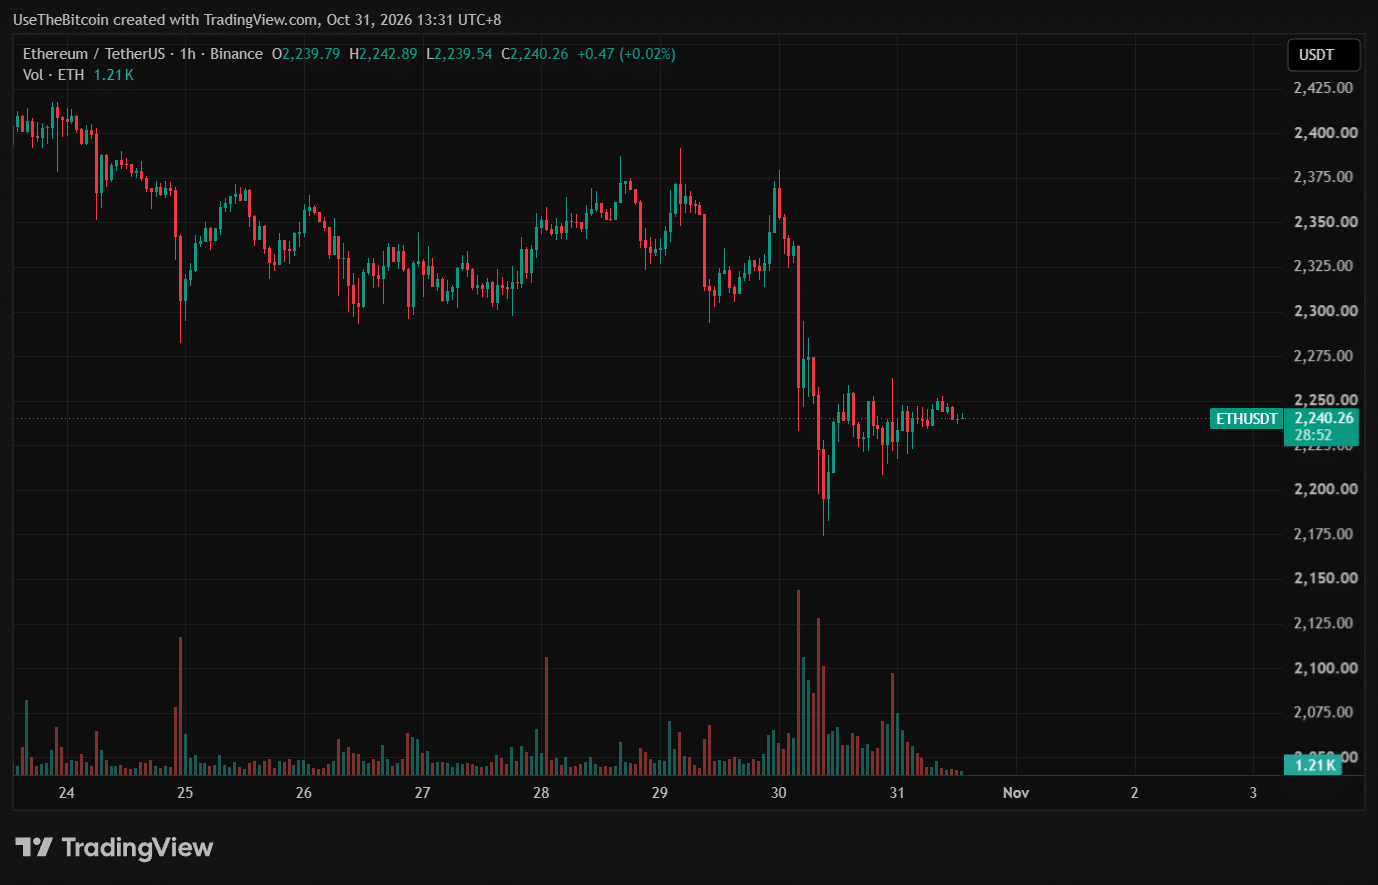
So what does volume really tell you? First, it tells you about liquidity. In an active market with high volume, orders tend to get filled faster and closer to what you expect.
Next is conviction. If the price rises and the volume also swells, it usually means the move has real participation and it is not manipulated. A price rising with low volume might not last long.
Third is attention shifts. A sudden volume spike might be news, a technical analysis breakout, or a key level in play. Fading volume can signal that interest is leaving.
Overall, here’s a table on how to read volume to make matters simple.
| What is the price trend | What is the volume trend | Possible result |
| Up | Up | Strong buying |
| Down | Up | Strong selling |
| Up | Down | Weak rally |
| Down | Down | Slowdown |
Please remember that this table is only theoretical and not a guarantee. It is more like a weather forecast to predict the future.
Putting it together: reading one chart, start to finish
Overall, reading charts takes a long process and it is definitely not a one-day workshop. To practice, make sure you open TradingView every day and look at the chart of Bitcoin or Ethereum.
Once you get better at it, you can explore more advanced strategies beyond candlestick analysis, because a good trader does not rely on just one strategy. This tutorial would be for nothing if you do not apply it daily.
Common beginner mistakes
Most mistakes beginners make when studying charts are that if it looks like something they have studied, they will immediately assume that it will work out. Sadly, that is not how it usually goes. Chart patterns are probabilities and not certainties.
For example, bullish flags have a 70% chance of breaking out, and that percentage drops even further if it creates another bull flag, assuming the price trend is forming higher lows and higher highs.
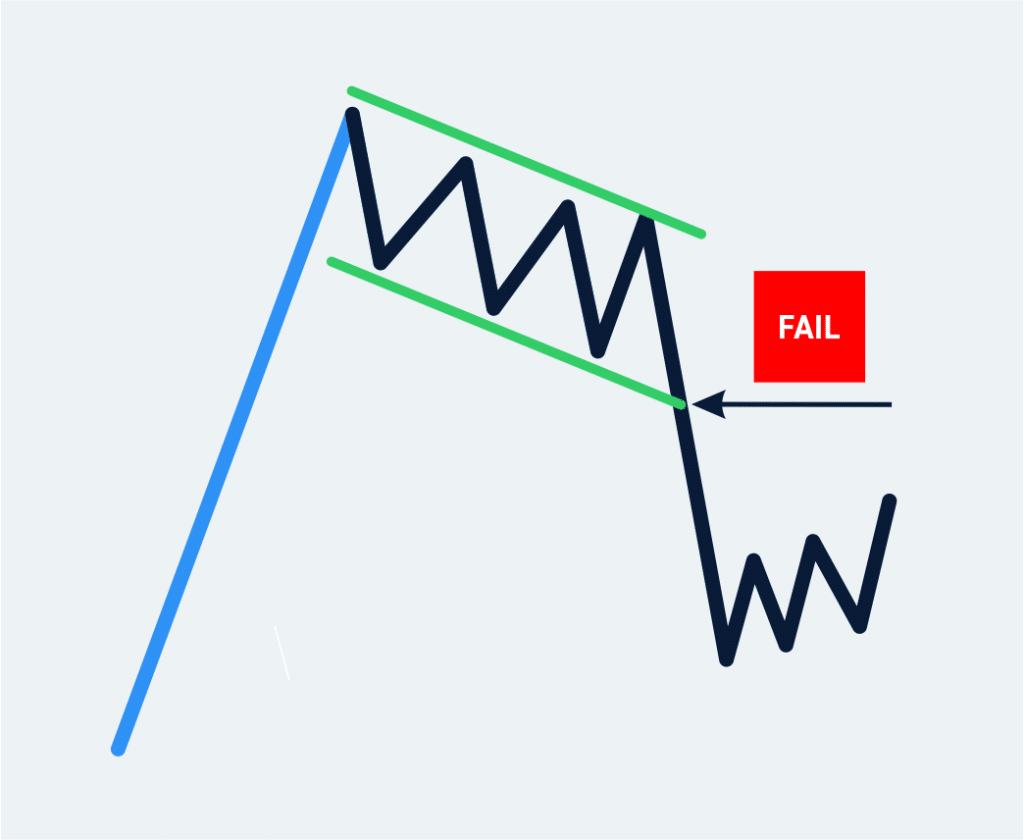
Also, don’t get frustrated if the chart pattern you are looking at over the past few days did not break out in the end. Instead, trade the reaction. If the pattern failed, you go short. If the pattern did break out, then you go long.
Frequently Asked Questions
Do you need more clarification regarding candles, charts and indicators? You can find more answers below.
How do I interpret candlestick patterns?
Candlestick patterns give insights into possible market reversals or continuations. Traders can make better trading decisions if they know how to read and interpret candlesticks because each candlestick in the chart represents a “story.” And by learning to interpret candlestick patterns takes months or even years of practice, so get the hang of it at your own pace!
What role do candlestick charts play in risk management?
Candlesticks can’t really tell you what to do for risk management. It is up to the trader how he/she is going to react based on the candlesticks being printed on the chart. If a trader misreads the candlesticks, he/she can cut losses or set a stop loss to avoid losing money.
How can I use candlestick charts for timing trade entries and exits?
Yes, it is very possible but it is not a hundred percent effective. Yes, it gives you an advantage because you know how to read charts, but crypto prices are very volatile, so you need to set expectations as well. You also need confluences like momentum indicators, and you should pair them with your candlestick charting to get a clearer view of the market.
More crypto guides: Guides hub · What is cryptocurrency · What is a seed phrase · 7 crypto scams to avoid